
Incrementality testing measures the causal lift your marketing produces by comparing an exposed group to a randomized holdout. Use it when you need proof that ad spend drove net-new outcomes, not just correlated ones. Attribution models tell you who converted; incrementality testing tells you whether your ads caused the conversion at all. That distinction shapes every budget decision that follows.
Before you plan a test, check whether your conversion volume can support one. The feasibility formula is straightforward: you need approximately 15.68 ÷ (relative lift)² conversions per group. Detecting a 10% lift requires approximately 1,568 conversions per group, according to the standard formula (15.68 ÷ 0.10²). If your volume falls short, a geo-based or synthetic control design is usually the better path.
The three primary test designs are:
- Randomized audience holdout (platform lift): users are split at the platform level into exposed and holdout groups; best for digital channels with high conversion volume.
- Geo (market) holdout: matched geographic markets serve as test and control; suited for retail, TV, out-of-home, and retail media where user-level randomization is impractical.
- Synthetic control: a statistical model constructs a counterfactual from historical data when randomization is impossible; useful for always-on channels or small-market tests.
Adoption is accelerating. EMARKETER’s 2026 FAQ on incrementality documents a significant share of marketers increasing incrementality investment, driven by the collapse of third-party cookies and growing pressure to justify channel spend with causal evidence.
Table of Contents
- How incrementality testing works: the three core methods
- How to design a test that gives you answers you can trust
- Putting the test into operation: tools, data, and privacy
- Building an incrementality testing program across your organization
- How incrementality fits into your full measurement stack
- Key Takeaways
- Why most organizations underinvest in incrementality until it’s too late
- Magiclogix helps you build a measurement program that actually moves budgets
- Useful sources
- FAQ
How incrementality testing works: the three core methods
Each method answers the same question differently: what would have happened without the ad? The right choice depends on your data environment, conversion volume, and channel type.
Randomized audience holdout
Platforms like Google split your campaign audience into two groups at the user level. The exposed group sees your ads normally; the holdout group is suppressed. After the test window, the platform compares conversion rates between groups. Google Conversion Lift supports both user-based and geography-based lift studies, and it calculates incremental ROAS directly from the results, which makes it practical for budget reallocation decisions.
This method works well when you have a single digital channel with enough conversion volume and when user-level randomization is technically feasible. The limitation is contamination: if the same user appears in multiple campaigns or channels, holdout integrity breaks down.
Geo (market) holdout
Geo experiments assign matched geographic markets to test and control conditions. One set of markets runs the campaign; the matched set goes dark or holds a baseline spend level. The difference in outcomes between markets, adjusted for pre-period trends, estimates the causal lift.
This design suits retail, TV, out-of-home, and retail media scenarios where you cannot suppress ads at the user level. Matching quality is everything here. Markets should be similar in size, seasonality, and baseline conversion rate before the test begins. A poorly matched control market produces a biased estimate that no amount of post-hoc adjustment can fully correct.
Synthetic control
When randomization is impossible and you have too few markets for a clean geo match, a synthetic control constructs a weighted combination of untreated units that mirrors the treated unit’s pre-period behavior. The gap between the treated unit and its synthetic counterpart during the test period estimates lift.
This approach requires clean historical data and careful validation of the pre-period fit. It is more assumption-dependent than a randomized holdout, but it is often the only credible option for always-on channels or markets where you cannot turn spend off entirely.
“Experiments are the gold standard for establishing causality in digital advertising — and in a privacy-constrained world, they are increasingly the only reliable way to validate what attribution models report.”
Harvard Business Review
Method comparison at a glance:
| Method | Best for | Data requirements | Sample size / detectable lift | Typical duration | Strengths and limitations |
|---|---|---|---|---|---|
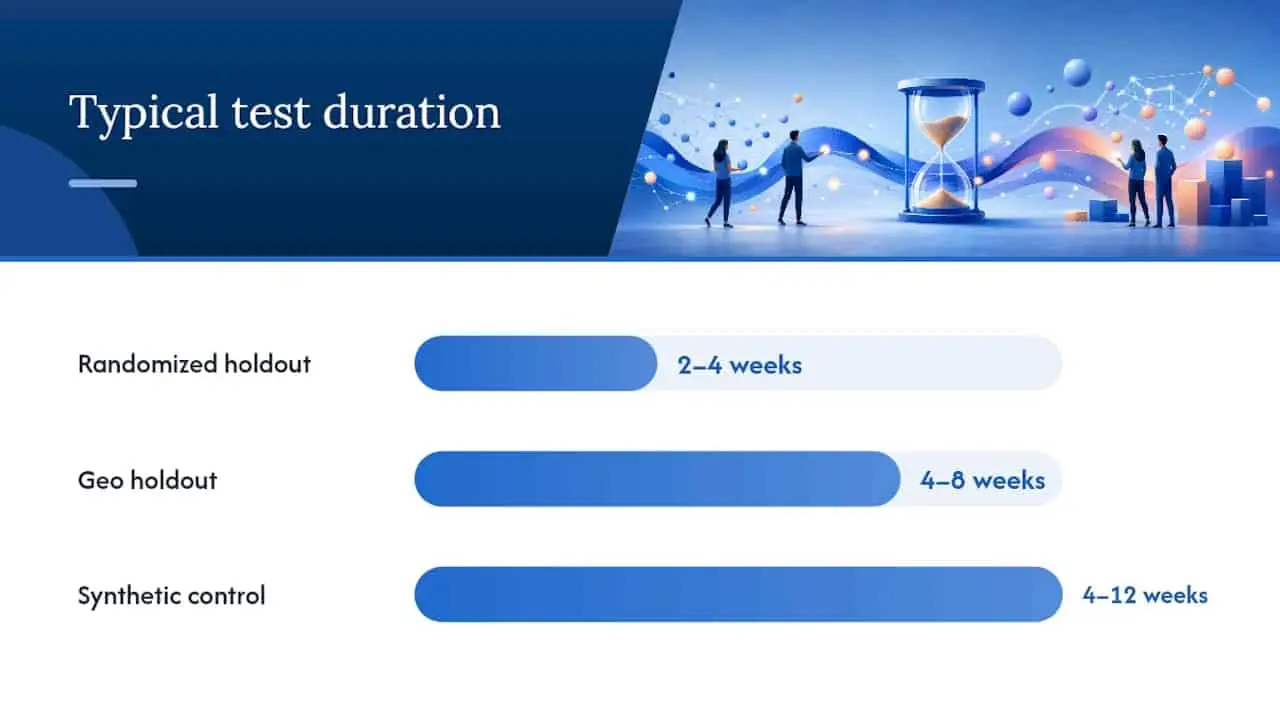
| Randomized audience holdout | High-volume digital channels | User-level events, platform integration | A substantial number of conversions per group needed for modest detectable lifts | 2–4 weeks | High internal validity; requires volume and platform access |
| Geo holdout | Retail, TV, OOH, retail media | Market-level sales or conversions | Depends on market variance; fewer markets = wider CI | 4–8 weeks | Works without user IDs; sensitive to market matching quality |
| Synthetic control | Always-on channels, small markets | Long pre-period time series | No minimum user count; needs stable pre-period | 4–12 weeks | Flexible; assumption-heavy and harder to validate |
A quick example: A mid-size e-commerce retailer running retail media campaigns wanted to know whether its sponsored product ads drove incremental purchases or just captured shoppers who would have bought anyway. With 2,400 weekly conversions, a randomized holdout was feasible. The test ran for three weeks, revealed a 14% incremental lift, and directly informed a budget increase for that channel.
How to design a test that gives you answers you can trust
Good test design starts with a decision, not a metric. Ask: what single question will this test answer, and what will you do differently depending on the result? If the answer to that question does not change a budget, a channel mix, or a creative strategy, the test is not worth running.
- Write the decision rule first. State explicitly: “If incremental ROAS exceeds X, we increase budget by Y%. If it falls below Z, we pause or reallocate.” Pre-committing to this rule prevents post-hoc rationalization.
- Compute your minimum detectable effect (MDE). Use the formula: conversions needed per group = 15.68 ÷ (relative lift)². If you expect a 20% true lift, you need roughly 392 conversions per group (15.68 ÷ 0.20²). If you expect a 5% lift, you need about 6,272 per group (15.68 ÷ 0.05²). Most teams underestimate how large holdouts need to be for small expected lifts.
- Choose holdout size deliberately. A 5% holdout minimizes forgone revenue but requires very high conversion volume to detect modest lifts. A 10% holdout is a reasonable default for mid-volume channels. A 20% holdout gives you statistical power faster but costs more in suppressed impressions. There is no free lunch: power and revenue opportunity trade off directly.
- Control for contamination. For audience holdouts, check for overlap between campaigns targeting the same users. For geo tests, choose markets with minimal cross-border shopping or media spillover. Document overlap before launch, not after.
- Set the test window before you start. Typical digital holdouts run 2–4 weeks; geo tests often need 4–8 weeks to accumulate enough signal. Shorter windows increase the risk of underpowered results; longer windows increase exposure to external shocks like seasonality or competitor promotions.
- Pre-register everything. Write down the start date, end date, primary metric, secondary metrics, and stopping rules before the test launches. No peeking at interim results. Checking significance repeatedly inflates false positives and makes your confidence intervals meaningless.
- Define your primary metric and secondary metrics. Incremental conversions is the primary metric. Incremental revenue and incremental ROAS are secondary. Avoid adding metrics after the test starts.
Pro Tip: Most teams set MDE targets based on what they hope to see, not what the channel can realistically produce. Pull your last 90 days of conversion data, run the feasibility formula, and let the math tell you whether a platform holdout is viable or whether you need a geo design with a longer window.
Putting the test into operation: tools, data, and privacy
Translating a test design into a running experiment requires three things: the right platform or measurement partner, clean data flows, and privacy-safe execution.
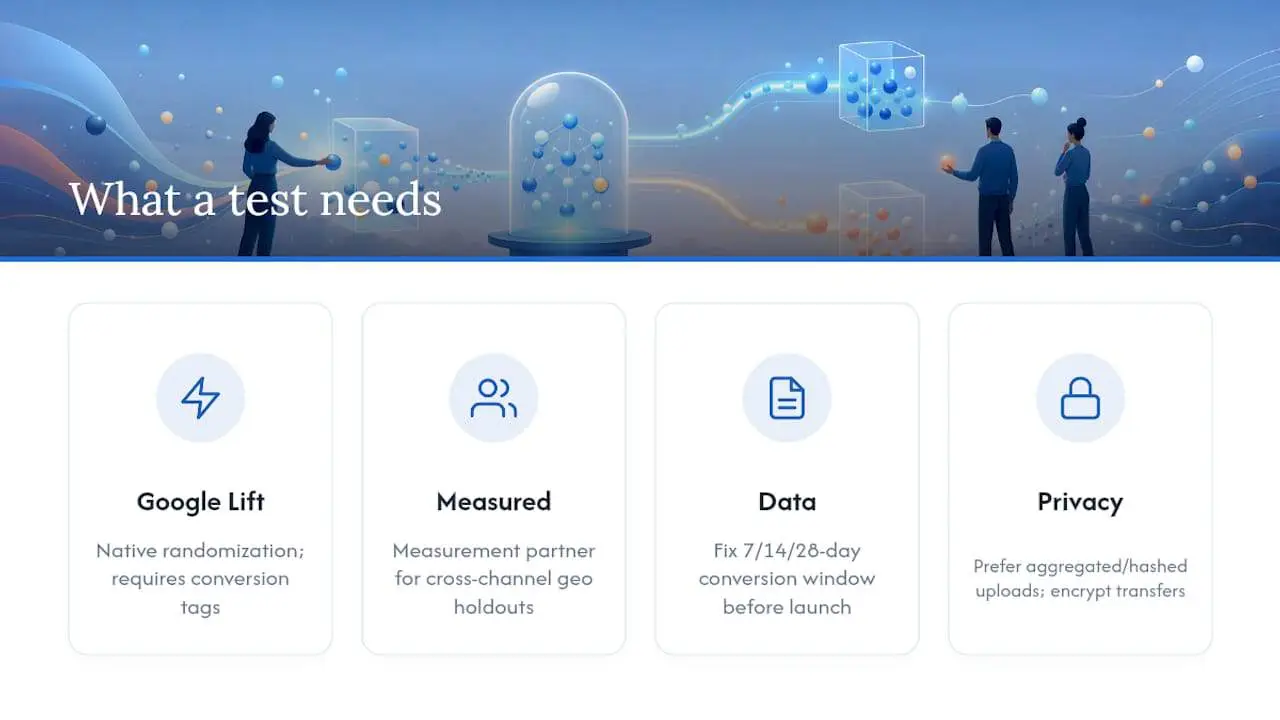
Platform options. Google Conversion Lift handles user-level randomization natively for Google campaigns, including Performance Max. It requires conversion tracking to be active and properly tagged. For retail media, measurement partners like Measured specialize in cross-channel holdout design and can run geo experiments across channels that do not offer native lift tools.
Data requirements. You need first-party conversion events with consistent attribution windows. Decide on your conversion window before the test (7-day, 14-day, or 28-day post-click) and hold it constant. Delayed conversions are a common source of undercounting: a 7-day window misses purchases that happen on day 10. Match quality matters too. If you are uploading hashed customer lists for audience suppression, match rates below 50% can introduce systematic bias into the holdout.
Instrumentation checklist before launch:
Confirm conversion tags fire on all relevant pages. Validate server-side event uploads if you use them. Check that hashed identifiers (SHA-256 email hashes) are formatted consistently. Verify that your attribution window in the platform matches your analysis window. Run a pre-period sanity check: do test and control groups show similar baseline conversion rates before the test begins?
Privacy and security. Prefer aggregated or hashed data uploads over raw user-level exports. When handling first-party data for holdout suppression, follow ISO 27001-aligned security practices for data storage and transfer: encrypt data in transit, limit access to the minimum necessary team members, and avoid storing raw personally identifiable information outside your own systems. Platform-native lift tools like Google Conversion Lift handle randomization server-side, which reduces the amount of user-level data you need to export at all.
Pro Tip: Run a “pre-test” for one week before launch. Compare conversion rates between your intended test and control groups using historical data. If the rates diverge by more than a few percentage points before the test starts, your randomization or market matching has a problem. Fix it before you spend the budget.
Building an incrementality testing program across your organization
A single test is a data point. A program is a competitive advantage. Here is how to build one that scales.
- Prioritize channels by spend, strategic risk, and expected uncertainty. Start with your highest-spend channel where you have the least causal evidence. That is almost always the right first test. Use a simple 2×2: high spend + high uncertainty = test first; low spend + low uncertainty = test later.
- Set a cadence that matches your organization’s size. Mid-market teams typically run 2–4 tests per year, rotating across channels. Large brands with dedicated measurement teams can run quarterly rotations, testing each major channel at least once per year. EMARKETER’s guidance supports a cadence that balances cost and coverage without burning out internal resources.
- Assign clear ownership. Someone owns the hypothesis. Someone owns randomization and data. Someone owns analysis. Someone owns the decision that follows. Without explicit ownership, tests get launched but results never reach the people who control budget.
- Budget for test costs. Holdouts suppress revenue during the test period. A 10% holdout on a $500,000/month channel costs about $50,000 in suppressed impressions per month of testing. That is the price of causal evidence. Factor it into your measurement budget, not your media budget.
- Build a test registry. A shared document that tracks every test: channel, hypothesis, design, dates, results, and the decision that followed. This becomes your institutional memory and prevents duplicate tests or conflicting designs.
- Use results to update your media planning and channel mix. A test result that sits in a slide deck and never changes a budget decision is wasted. Build a direct link between test outputs and your quarterly planning cycle.
- Plan the first 12 months. Months 1–2: feasibility audit and MDE calculations for top three channels. Months 3–4: first test design, pre-registration, and launch. Months 5–6: analysis and budget decision. Months 7–9: second test, incorporating lessons from the first. Months 10–12: program review, cadence formalization, and governance documentation.
| Prioritization criterion | Weight | Notes |
|---|---|---|
| Channel spend | High | Higher spend = higher ROI from causal evidence |
| Strategic risk | High | Channels under budget scrutiny get tested first |
| Expected lift uncertainty | Medium | Test channels where attribution and intuition disagree |
| Ease of execution | Medium | Platform-native lift tools reduce setup time |
How incrementality fits into your full measurement stack
No single method answers every measurement question. Incrementality testing, marketing mix modeling (MMM), and attribution each serve a distinct role, and the most reliable measurement programs use all three.
Measured’s decision-tree framework maps the three methods clearly: attribution answers “which touchpoints preceded conversion?” and supports daily in-channel optimization. MMM answers “how does spend across channels affect total revenue?” and drives portfolio-level budget allocation. Incrementality testing answers “did this channel cause net-new outcomes?” and provides the causal validation that neither attribution nor MMM can produce on its own.
The most powerful use of incrementality results is as calibration inputs for MMM. When you run a holdout experiment and measure a channel’s true causal lift, that result can become a Bayesian prior inside your MMM, anchoring the model’s coefficient for that channel. Without that anchor, MMM coefficients drift over time as the model picks up correlational signals that do not reflect true causality. Measured’s Causal MMM guidance and Presenc AI’s comparison both recommend this integration pattern: run experiments periodically to calibrate MMM, use MMM as the always-on portfolio optimizer, and use attribution for in-channel execution decisions.
Pro Tip: When you feed an incrementality result into your MMM as a prior, document the test date, channel, lift estimate, and CI. If the MMM coefficient drifts significantly from that prior in a future run, that is a signal worth investigating — either the channel’s true lift changed, or the model is picking up a spurious correlation.
The triangulation approach does have limits. If your total conversion volume is below a few hundred per month, you cannot run valid holdout experiments and your MMM will have too little data to produce stable coefficients. In that case, attribution with careful channel-level analysis is your primary tool, supplemented by industry benchmarks and predictive analytics to fill the gaps.
Key Takeaways
Incrementality testing is the only method that proves causal lift, and it works best as the causal anchor inside a triangulated stack of experiments, MMM, and attribution.
| Point | Details |
|---|---|
| Run the feasibility check first | You need approximately 1,568 conversions per group to detect a 10% lift; use the formula 15.68 ÷ lift² before designing any test. |
| Match method to constraints | Randomized holdouts suit high-volume digital channels; geo tests suit retail and TV; synthetic controls work when randomization is impossible. |
| Pre-register and never peek | Declare your end date, metrics, and decision rules before launch; interim peeking inflates false positives and invalidates your confidence intervals. |
| Use results to calibrate MMM | Feed incremental lift estimates into your MMM as Bayesian priors to prevent coefficient drift and keep your portfolio model grounded in causal evidence. |
| Magiclogix supports measurement program design | Magiclogix’s analytics and data services help teams build the data flows, test architecture, and MMM integration needed to run a credible incrementality program. |
Why most organizations underinvest in incrementality until it’s too late
The honest reason most marketing teams skip incrementality testing is not budget. It is organizational friction. Finance wants to see a number; media teams worry the holdout will make their channel look bad; and analysts are not sure the conversion volume is there to support a valid test. All three objections are real, and none of them go away on their own.
The finance objection is the easiest to address. Frame the holdout cost as a measurement investment, not a media loss. A 10% holdout on a $200,000/month channel costs about $20,000 per month of testing. If the test reveals that 40% of attributed conversions were not incremental, you have just identified $80,000 per month in misallocated spend. The math is clear.
The media team objection is harder because it is partly political. Channels that look strong in attribution often look weaker in a holdout, and the people who manage those channels have a stake in the attributed numbers. The right governance move is to make test results a shared input into planning, not a verdict on a channel manager’s performance. Framing tests as “learning investments” rather than “audits” changes the conversation.
The analyst objection is the most legitimate. Underpowered tests produce results that are genuinely uninterpretable, and running a bad test is worse than running no test. The solution is to do the marketing effectiveness feasibility work first, every time, and to be honest with stakeholders when the volume is not there. A geo test or a synthetic control is not a consolation prize; for many channels, it is the right design.
The teams that build durable incrementality programs are the ones that treat the first test as a proof of concept for the process, not just the channel. Get one clean result, connect it to a real budget decision, and the organizational resistance drops considerably.
Magiclogix helps you build a measurement program that actually moves budgets
Most measurement programs stall because the data infrastructure is not ready for testing. Conversion events are misconfigured, attribution windows are inconsistent, and there is no process for turning a test result into a budget decision.

Magiclogix’s analytics and data engineering services are built for exactly this gap. The team designs the data flows, configures first-party event tracking, and builds the MMM integration layer that lets incrementality results feed directly into your planning models. Whether you need a single channel test or a full measurement stack covering paid search, paid social, and retail media, Magiclogix handles the architecture so your analysts can focus on the decisions.
If you are ready to move from attributed ROAS to causal ROAS, reach out to Magiclogix to scope a measurement program designed around your conversion volume, channel mix, and budget cycle.
Useful sources
- FAQ on incrementality: How to prove your ads actually work in 2026
- Use incrementality testing for effective marketing measurement
- What Is Incrementality Testing and How to Run One | Soku
- MMM vs Incrementality Testing: Which Tells the Truth? | Presenc AI
- Incrementality vs Attribution vs MMM: Decision Tree
- What is incrementality testing vs MMM vs MTA? — Measured
- A new gold standard for digital ad measurement | HBR
FAQ
What is an example of an incrementality test?
A retailer running paid search ads holds out 10% of its audience from seeing ads for three weeks, then compares conversion rates between the exposed and holdout groups. If the exposed group converts at 4.0% and the holdout at 3.2%, the incremental lift is 25%, and the team can calculate exactly how many purchases the ads caused.
What is the difference between A/B testing and incrementality testing?
A/B testing compares two versions of a creative, landing page, or offer to find which performs better within an exposed audience. Incrementality testing compares an exposed group to a holdout that receives no ad at all, measuring whether the ad itself drove conversions that would not have happened otherwise.
What is the difference between MMM and incrementality testing?
MMM uses historical spend and outcome data to estimate channel-level contribution across the full portfolio, running continuously and covering all channels at once. Incrementality testing runs a controlled experiment on a single channel or campaign to measure causal lift directly. The two methods work best together: experiments calibrate MMM coefficients, and MMM provides the always-on portfolio view that individual tests cannot.
How many conversions do you need to run a valid incrementality test?
Using the standard formula, detecting a 10% true lift at 95% confidence and 80% power requires approximately 1,568 conversions per group. Smaller expected lifts require proportionally more volume; a 5% lift requires about 6,272 conversions per group.
When should you use incrementality testing instead of attribution?
Use incrementality testing when you need causal proof for a budget decision, when you suspect attribution is overcounting a channel’s contribution, or when you are evaluating whether to enter or exit a channel entirely. Attribution remains useful for daily in-channel optimization where speed matters more than causal precision.
Recommended
- Digital Marketing Performance Metrics: A Pragmatic Guide to Growth
- Boost Your Tech Business with Effective IT Marketing
- How to Improve Marketing Efficiency A Strategic Guide for 2026
- Failed Marketing Campaigns: A Guide to Fixing failed marketing campaigns