

Customer journey mapping is a research-backed visual narrative that shows customers’ actions, feelings, and touchpoints and converts those insights into prioritized improvements. A good map reveals where customers struggle, what they feel at each stage, and which fixes matter most. Built on real interviews and behavioral data rather than guesswork, it also gives marketing, product, and support teams a shared reference so everyone pulls in the same direction.
TL;DR:
- Map one persona through one defined scenario, use consistent stage names across departments, and assign a named owner to every opportunity.
- Build a hypothesis map first, then validate disputed assumptions with interviews and behavioral data such as analytics, CRM records, and support tickets.
- Use a timeline for a straightforward single persona journey, a swimlane when departments share touchpoints, and a service blueprint when internal systems drive the problem.
- Assess each opportunity for reach, severity, and effort; tackle fixes affecting many customers at low cost first, and reserve complex work for dedicated projects.
- Review the map at least quarterly, update it with measured outcomes, and tie each stage to a relevant KPI such as conversion, churn, or referrals.
Table of Contents
- Key Components Every Effective Journey Map Includes
- Step-By-Step Mapping Process You Can Run (Workshop-Ready)
- Research Methods and How to Combine Qualitative and Quantitative Data
- Templates and Visualization: Which Format to Use and What to Include
- Measuring Impact and Prioritizing Opportunities From Your Map
- Common Mistakes and Governance So Your Map Actually Drives Change
- 90-Day Implementation Checklist: Convert Insights Into Experiments and Projects
- Different Types of Journey Maps and When to Use Each
- Connecting Journey Maps to Marketing Automation and Predictive Analytics
- Examples of Journey Mapping Impact Across Industries
- How We Apply Journey Mapping in Client Work
- How Magic Logix Supports Your Journey Mapping Work
- FAQ
- Sources
Key Components Every Effective Journey Map Includes
Before you draw a single box, you need to know what belongs on the map. A map missing any of these pieces tends to look polished but say very little.
Every map starts with a point of view: a specific persona moving through a specific scenario. Trying to map “all customers” at once produces something too vague to act on. Pick one persona type and one goal, like a first-time buyer trying to complete a purchase, and build from there.
From there, you lay out the stages of the experience, such as awareness, consideration, purchase, onboarding, and advocacy. Core map elements include point of view, scenario, actions, mindsets, emotions, touchpoints, and channels, along with insights tied to ownership. Naming your stages consistently matters more than it sounds: when sales calls one stage “evaluation” and support calls it “decision,” cross-team conversations about the map break down fast.
Each stage needs its own row of detail:
- Touchpoints and channels: the specific pages, calls, emails, or in-store moments where the customer interacts with you.
- Actions: what the customer is actually doing at that point, in their own words where possible.
- Emotions and pain points: the frustration, confusion, or relief the customer feels, usually captured as a simple line or icon.
- Motivations: why the customer is moving forward, which helps explain behavior that otherwise looks irrational.
- Opportunities and ownership: the specific fix a stage needs and the named person or team responsible for it.
That last column is the one teams skip most often, and it is the one that determines whether the map changes anything. A map without an owner attached to each insight tends to sit in a shared drive untouched.
Step-By-Step Mapping Process You Can Run (Workshop-Ready)
Here is a workshop-ready sequence you can run with a cross-functional team. NN/g outlines a five-phase framework that moves from internal alignment to external validation, and the structure below builds on that approach.
- Set goals, scope, and assemble allies. Decide which persona and scenario you are mapping, then pull in people from marketing, support, product, and sales so no single department’s blind spots dominate the map.
- Inventory internal data and interview stakeholders. Pull existing analytics, support tickets, and sales notes, then talk to the frontline employees who deal with customers daily; they often know the pain points before any dashboard shows them.
- Build a hypothesis map in a workshop. Sketch the journey as your team currently understands it, flagging every assumption that has not been tested. A hypothesis-first approach lowers the barrier to getting started and builds internal buy-in quickly, though it needs to be checked against real evidence before anyone acts on it.
- Run targeted external research. Validate or correct your hypothesis map with user interviews, voice-of-customer data, and analytics, focusing on the stages where your team disagreed most during the workshop.
- Visualize, assign owners, and socialize the map. Turn the validated findings into a clean visual, attach an owner to every major insight, and present it to the teams who will act on it.
Pro Tip: Timebox the hypothesis workshop. Teams that let it run too long may debate internal opinions instead of planning the research that will actually settle them.
NN/g’s research on journey mapping frames the process itself as the real payoff: building consensus across departments matters as much as the finished diagram. A map built entirely by one team rarely survives contact with the rest of the organization, because nobody outside that team feels ownership over what it says.
Research Methods and How to Combine Qualitative and Quantitative Data
A journey map is only as credible as the evidence behind it, and the strongest maps mix two very different kinds of input.
Qualitative methods tell you why customers feel the way they do. Prioritize:
- User interviews, which remain the most relied-upon method among practitioners: NN/g’s 2023 survey found a large majority of practitioners use interviews for external user research, and a slightly smaller majority use them internally with stakeholders.
- Diary and contextual studies, which capture behavior as it happens rather than as customers remember it afterward.
- Small-sample depth interviews, which surface the specific language and emotion a survey question can’t reach.
Quantitative sources tell you how often and how widely a pattern occurs. These include web analytics, CRM logs, support ticket volume, and NPS or other voice-of-customer scores. Behavioral analytics and CRM data help confirm whether a pain point you heard about in three interviews is actually affecting a meaningful share of your customer base.
The practical hybrid approach is simple: run the hypothesis-first workshop described earlier, then send your team out to validate the specific assumptions that carried the most disagreement or risk. This keeps research focused instead of open-ended, and it stops teams from spending weeks interviewing customers about stages nobody actually questioned.
To turn raw data into mapped emotions and pain points, look for patterns that repeat across sources. If support tickets spike at the same stage where interview subjects mention confusion, and analytics show a drop-off at the matching page, you have converging evidence pointing at a root cause rather than a one-off complaint.
Templates and Visualization: Which Format to Use and What to Include
The right visual format depends on what question you are trying to answer. A timeline map works well for a single persona moving through a straightforward funnel, like a first purchase. A swimlane format adds horizontal rows for different departments or channels, which helps when multiple teams touch the same stage. A service blueprint goes a layer deeper, mapping the customer-facing journey against the internal processes and systems that support it, which is useful when the fix lives behind the scenes rather than on the surface.
Whatever format you choose, every visual needs the same minimum fields:
- Persona and scenario stated clearly at the top.
- Stages labeled consistently across the whole map.
- Touchpoints tied to specific actions, not vague descriptions.
- Emotions, often shown as a simple line graph or color code.
- KPIs relevant to that stage.
- Owner for each flagged opportunity.
A few tool-agnostic habits make maps easier to read. Chunk the journey into clear phases rather than one long continuous timeline. Use color consistently for emotion, so a reviewer can scan the map and immediately see where sentiment drops. Stick to one point of view per map; combining two personas on a single diagram usually confuses both stories. A minimal map might be a single row per stage with touchpoint, emotion, and opportunity. A cross-functional blueprint adds rows beneath it for the systems, staff, and processes that deliver each touchpoint.
Measuring Impact and Prioritizing Opportunities From Your Map
A journey map only earns its keep once it changes a metric. Tie each stage to the KPI that actually reflects progress there: engaged visits or time on page for discovery, trial signups for the try stage, conversion rate for purchase, churn or repurchase rate for retention, and NPS or referral volume for advocacy.
Once you have a list of opportunities from the map, you need a way to choose which ones to tackle first:
- Score each opportunity on impact, estimating how many customers it affects and how severely.
- Score each opportunity on effort, factoring in the time, budget, and teams required to fix it.
- Plot both scores on a simple impact-effort matrix and start with the high-impact, low-effort items.
- Reserve high-impact, high-effort items for a dedicated project rather than a quick fix.
Research on customer journeys shows that customers tend to prefer experiences that stay consistently positive or steadily improve over the course of an interaction, and the final impression often carries the most weight in overall satisfaction. That is a strong argument for prioritizing fixes near the end of the journey, like checkout or renewal, even when an earlier stage shows a louder complaint volume.
Once you have picked a priority, convert it into something trackable: a named experiment, a clean remediation ticket, or a short project with a success metric attached before anyone starts building.
Common Mistakes and Governance So Your Map Actually Drives Change
Most journey maps fail for predictable reasons, and most of them are avoidable with a little discipline.
- Company-first thinking: building the map around your internal process instead of the customer’s actual experience produces a flowchart, not a journey map.
- Unvalidated assumptions: treating the hypothesis workshop as the finished product instead of a starting point for research.
- Overcomplicated visuals: cramming every detail onto one page until nobody can read it in a meeting.
- No clear ownership: leaving insights unassigned so nobody feels responsible for acting on them.
HBS Online notes that maps frequently fail specifically because they lack clear ownership, and recommends treating the map as a living document reviewed and updated at least quarterly rather than a one-time deliverable.
Pro Tip: Put a recurring calendar invite on the books the same day you finish the map. A review that depends on someone remembering to schedule it later rarely happens.
90-Day Implementation Checklist: Convert Insights Into Experiments and Projects
A finished map is only useful once someone turns its findings into action. Here is a lean implementation sequence:
- Start with an audit: Identify key pain points in the map, then assign an owner to each one.
- Week 2 to 3: Define a success metric for each pain point and pick one experiment or remediation project to address it.
- Check progress: Review each owner’s first milestone and confirm the experiment is live or the fix is underway.
- Review interim results: Compare progress with the chosen metrics and adjust scope for anything underperforming.
- Review outcomes: Measure results against the original baseline, update the relevant section of the map, and decide whether to expand the effort to additional stages.
Keeping this cycle tight matters more than making it comprehensive. Three well-executed fixes with measured outcomes build more internal trust in the map than a long list of good intentions nobody tracked.
Different Types of Journey Maps and When to Use Each
Not every map serves the same purpose, and picking the wrong type wastes the research you put into it.
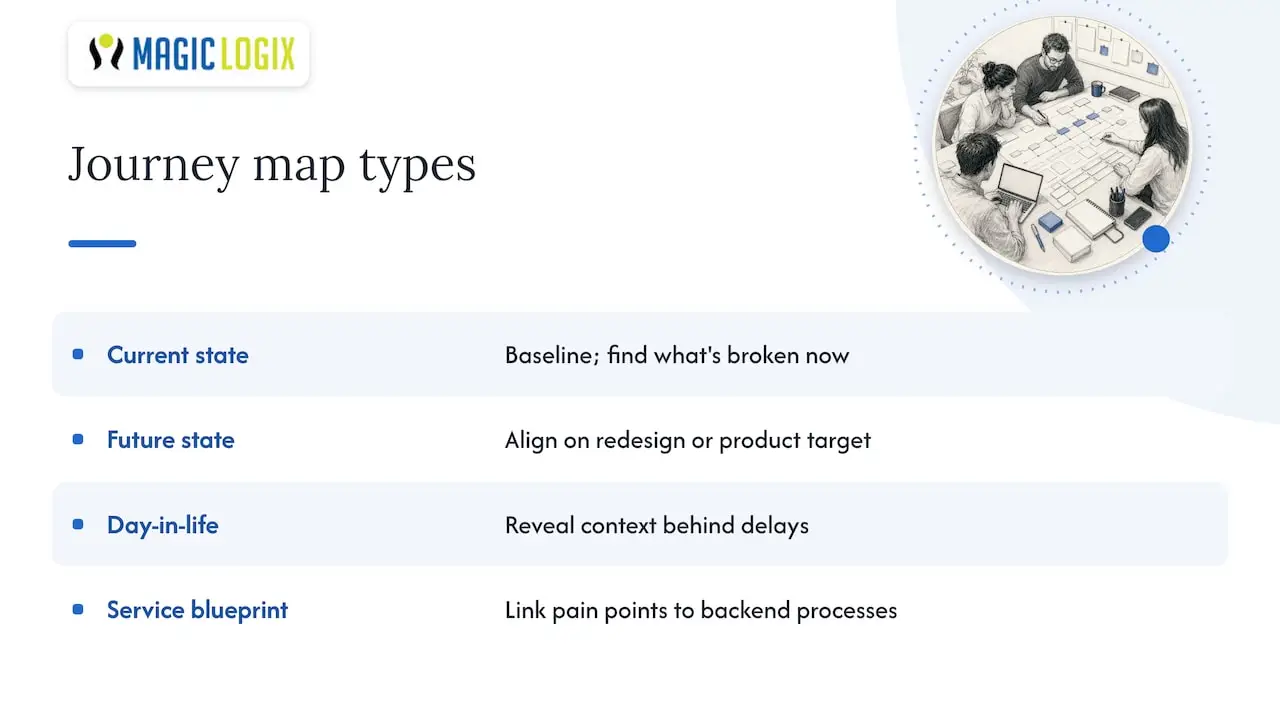
A current state map documents the experience as it exists today, pain points and all. This is the most common starting point because it gives you a baseline to improve from. A future state map sketches the experience you want to build, which is useful when you are planning a redesign or a new product line and want the team aligned on the target before development starts.
A day-in-the-life map zooms out from a single transaction to the customer’s broader daily context, showing where your product or service fits alongside everything else competing for their attention. This format is especially useful for understanding why a customer delays a purchase or abandons a task, since the real obstacle sometimes has nothing to do with your product directly.
Some teams also build a service blueprint as a variant that pairs the customer-facing current state map with the internal operations behind it, which helps when the fix for a pain point lives in a backend process rather than the interface.
Choosing the right type starts with the question you are trying to answer. If you want to find what is broken right now, map the current state. If you are planning a change, map the future state. If you suspect the real barrier is contextual rather than transactional, a day-in-the-life map will surface that in a way a stage-by-stage map cannot.
Connecting Journey Maps to Marketing Automation and Predictive Analytics
A journey map that stays on a slide deck misses most of its value. The real payoff comes when the insights feed directly into the systems that run day-to-day marketing and sales.
Once you know which stage causes the most drop-off, marketing automation can trigger the right message at that exact moment, like a reminder email when a cart sits untouched or a check-in message after a support ticket closes. The map tells you where to intervene; the automation platform handles the delivery at scale.
Predictive analytics adds a forward-looking layer on top of the map’s current-state findings, helping forecast which customers are likely to churn or convert based on patterns the map already identified. Instead of waiting for a customer to hit the pain point your interviews uncovered, predictive models can flag the risk earlier and route that customer into a different workflow.
This integration only works when the map and the automation systems share consistent stage definitions. If your map calls a stage “consideration” and your CRM tags the same customers as “qualified lead,” the connection between insight and action gets lost in translation. Aligning that language across tools is a small task that pays off every time someone tries to act on what the map found.
Examples of Journey Mapping Impact Across Industries
Journey mapping shows up differently depending on the business, but the underlying pattern repeats: a validated map surfaces a specific friction point, and fixing it moves a specific metric.
In retail and ecommerce, mapping often exposes friction in the checkout and shipping stages, where small details like unclear delivery timelines or unexpected fees cause abandonment that no amount of top-of-funnel marketing can fix. In B2B software, maps frequently reveal that onboarding, not the sales process, is where new customers lose confidence, since a confusing setup experience can undo the trust a sales conversation built. In service industries like healthcare or financial services, maps often surface emotional friction tied to uncertainty or a lack of clear next steps, which points toward communication fixes rather than product changes.
Academic research on journey design found that a consistent, context-sensitive journey design meaningfully strengthens customer loyalty, with a stronger effect on utilitarian brand attitudes than on hedonic ones. That distinction is worth noting when you plan fixes: a functional product benefits most from consistency across touchpoints, while an experience-driven brand may need to invest more in the emotional high points the map identifies.
How We Apply Journey Mapping in Client Work
We approach every journey mapping engagement the way the research recommends: cross-disciplinary workshops first, then targeted validation through interviews and behavioral data, never assumptions alone. Our data-driven personas combine CRM and analytics signals with direct customer input, and we assign clear ownership so findings turn into action instead of sitting in a file. Clients can use these findings to identify opportunities to improve onboarding and address known friction points. If that sounds useful, we can discuss where your own map would start.
How Magic Logix Supports Your Journey Mapping Work
Running a thorough journey mapping project alongside your regular workload is hard, and that is exactly where outside support earns its place. We bring the research, analytics, and execution capacity to carry a mapping project from workshop to measurable outcome without pulling your team away from daily priorities.
Our services that support a mapping engagement include:
- Data analytics and business intelligence to validate hypotheses with real behavioral evidence through our capabilities.
- Marketing automation to turn mapped insights into triggered campaigns at the exact moment a customer needs them, through our digital marketing services.
- Web development and design to fix the touchpoints a map identifies as broken, through our web development team.
- SEO and content work to address discovery-stage friction a map uncovers, through our search engine optimization services.
If you have cross-disciplinary allies in place but need help assembling specialized roles for a mapping push, recruiting support for marketing and CX positions can fill gaps quickly without a lengthy hiring cycle. The next step on our end is simple: reach out to discuss your current customer data and what it would take to build a validated journey map.
FAQ
What are the 7 steps to map the customer journey?
Most frameworks compress to five core phases: setting goals and assembling a cross-disciplinary team, auditing internal data and interviewing stakeholders, building a hypothesis map, validating it with external research, and producing the final visual with assigned owners. Some teams split these into seven steps by separating persona definition and KPI assignment into their own stages, but the underlying sequence stays the same.
What is customer journey mapping?
Customer journey mapping is a visual, research-backed way to document the actions, emotions, and touchpoints a customer experiences while interacting with a business. It helps teams spot pain points and prioritize fixes based on real evidence rather than internal guesswork.
What are the 5 main points of a customer journey?
A complete map typically tracks the customer’s point of view and scenario, the stages they move through, the touchpoints and channels at each stage, their emotions and pain points, and the opportunities with assigned owners that come out of the analysis. Core elements like these form the backbone of most professional journey maps.
What are the 4 stages of customer journey mapping?
A common simplified version covers awareness, consideration, purchase, and retention or advocacy, though many maps add onboarding as a distinct stage between purchase and retention. The exact stage names vary by industry and business model, so consistency within your own organization matters more than matching an external standard.
How often should a customer journey map be updated?
A journey map works best as a living document rather than a one-time project, since customer behavior and channels shift over time. Reviewing and updating the map at least quarterly keeps it aligned with current data and prevents it from becoming an outdated artifact nobody trusts.
Sources
- Effective customer journey design: consumers’ conception, measurement, and consequences
- The 5 Steps of Successful Customer Journey Mapping – NN/G