

Blended ROAS is your total revenue divided by your total ad spend across every paid channel for the same period. If you booked $150,000 in revenue and spent $50,000 on ads, your blended ROAS is 3.0: three dollars back for every dollar spent. It is a fast health check on paid marketing. It is not proof of which channel did the work, and it does not tell you whether you made a profit.
This guide covers the formula, worked examples, how blended ROAS differs from channel ROAS and from the marketing efficiency ratio (MER), and how to judge whether your number is good for your margins.
TL;DR
- Blended ROAS = total revenue ÷ total paid ad spend for the same period. MER uses total marketing spend in the denominator instead.
- Platform dashboards each claim credit for the same orders, so adding their reported revenue overstates what you earned. Blended ROAS uses the revenue your store or books actually recorded.
- A “good” number depends on gross margin. The lower your margin, the higher the ROAS you need just to break even.
- Use blended ROAS or MER for budget conversations and channel ROAS for day-to-day campaign decisions.
- Track new-customer revenue separately, because returning customers can make blended numbers look better than acquisition really is.
Table of Contents
- What blended ROAS measures
- The blended ROAS formula
- Blended ROAS vs channel ROAS
- Blended ROAS vs MER
- What counts as a good blended ROAS?
- Common mistakes when calculating blended ROAS
- How to use blended ROAS in practice
- Perspective: Treat blended ROAS as a starting line
- Get a clearer read on your marketing returns
- FAQ
- Sources
What blended ROAS measures
Think of blended ROAS as the dashboard light on your car, not the diagnostic computer. It tells you whether something is broadly working. It cannot tell you which part is responsible.
It takes all the revenue your business recorded, whether it came from paid ads, organic search, email, direct visits or referrals, and divides it by what you spent on paid media. Because the numerator is real business revenue, it does not depend on any ad platform’s attribution rules.
That same design is its limit. One published explainer on blended ROAS notes that it cannot show which channel caused revenue, whether the revenue was incremental, whether profit is healthy, or whether new customer acquisition is working. Treat it as a sanity check, not a complete attribution model.
The blended ROAS formula
The formula is simple:
Blended ROAS = Total revenue (all channels) ÷ Total paid ad spend (all channels)
As one glossary entry puts it, the numerator is every dollar of revenue in the period, paid or not, while the denominator is only paid media spend.
Some teams express the result as a ratio (3.0x), others as a percentage (300%). Pick one and keep it consistent in every report.
Worked example: three paid channels
A store has $150,000 in total revenue for the month. It spent $24,000 on Meta, $16,000 on Google and $10,000 on TikTok.
- Add the spend: $24,000 + $16,000 + $10,000 = $50,000.
- Divide: $150,000 ÷ $50,000 = 3.0.
In this published example, the three platforms individually reported a combined $172,000 in revenue. That is $22,000 more than the store actually earned, because more than one platform claimed credit for the same orders. This is why the number to trust for the whole business is the one built from recorded revenue.
Worked example: blended ROAS next to MER
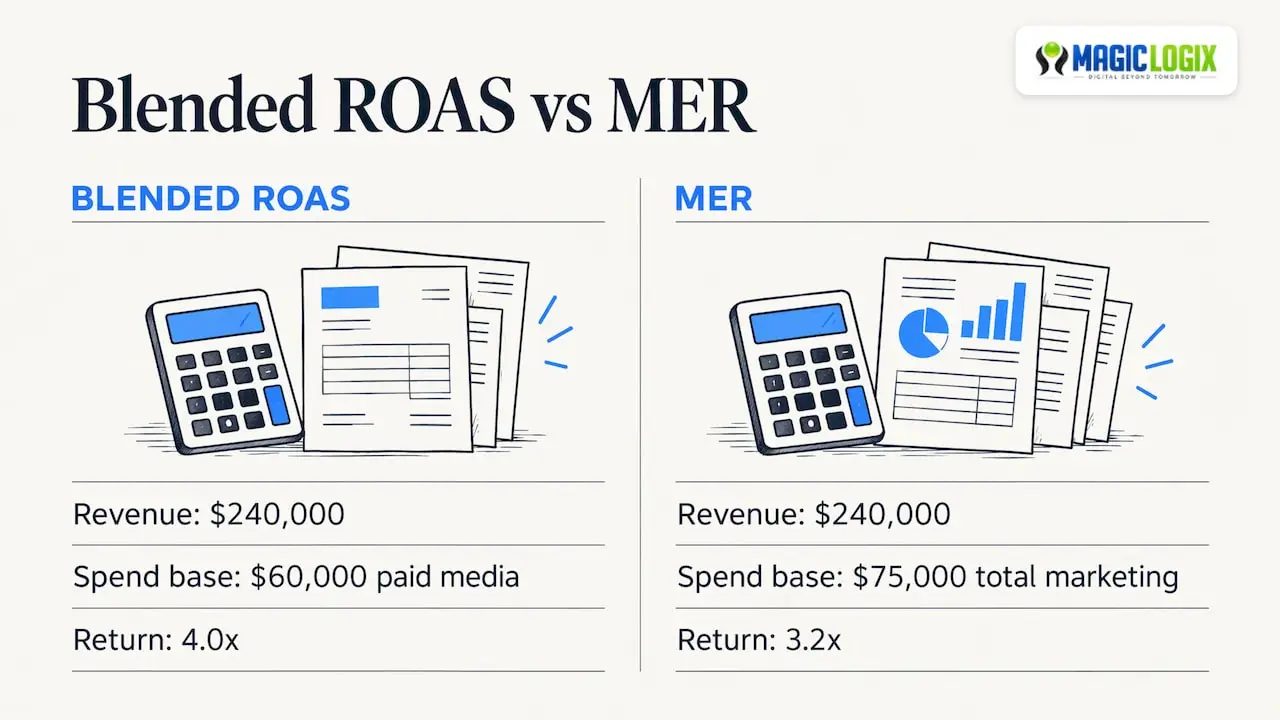
A brand has $240,000 in store revenue, $38,000 in Meta spend and $22,000 in Google Ads spend. Paid spend is $60,000, so blended ROAS is $240,000 ÷ $60,000 = 4.0.
Now add $9,000 in influencer fees and $6,000 in email and agency costs. Total marketing spend becomes $75,000, and the ratio falls to 3.2. That second figure is MER. This comparison uses the same numbers, and they show how much the answer changes depending on what you count as spend.
Blended ROAS vs channel ROAS
Channel ROAS is the return each ad platform reports for itself, using its own attribution model. Blended ROAS ignores which platform claimed the sale. Metric Hive’s comparison explains that the two ratios answer different questions and should be shown side by side rather than forced to match.
| Blended ROAS | Channel ROAS | |
|---|---|---|
| Revenue used | Observed business revenue | Revenue the platform attributes to itself |
| Spend used | All paid media | That platform only |
| Best for | Budget, board and finance conversations | Bidding, creative tests, pause or scale decisions |
| Main risk | Hides channel-level losses and flatters acquisition | Overlap between platforms inflates totals |
The practical rule: report the blended figure upward and use channel figures for tactical calls, since an ad platform’s algorithm only sees its own conversions and cannot optimize against your blended number.
Never add channel-reported revenue together and treat it as store revenue. The same source warns that the gap between summed channel ROAS and blended ROAS grows as you add channels and as organic demand grows.
Blended ROAS vs MER
Searchers often ask whether they should track MER or ROAS. They are close cousins with one difference: the denominator.
- Blended ROAS: total revenue ÷ paid ad spend.
- MER: total revenue ÷ total marketing spend, which can include agency fees, influencer payments, creative production and tools.
HubSpot describes MER as a blended, executive-level view of overall marketing effectiveness, and treats MER and ROAS as complementary rather than interchangeable. The Current adds that MER can capture sales effects that are hard to tie to a campaign, such as an influencer wearing your product.
Some analytics tools define things slightly differently, so check the definition inside any dashboard before comparing numbers across teams. One tool, for example, defines blended ROAS with revenue on top and calls the inverse ratio MER.
| Question | Use blended ROAS | Use MER |
|---|---|---|
| Is paid media working overall? | Yes | Partly |
| Are all marketing costs paying back? | No | Yes |
| Do you run a lot of non-ad activity (influencers, agency, content)? | Less useful | More useful |
| Comparing to a platform dashboard? | Closer match | Further away |
For deeper measurement beyond a single ratio, our guides on digital marketing performance metrics and an ROI measurement framework for marketing teams show how these numbers fit together.
What counts as a good blended ROAS?
There is no universal good number. Your gross margin decides it.
The quick break-even test: divide 1 by your gross margin. At a 50% margin, you need a ROAS of 2.0 just to cover the cost of the goods and the ad spend. At 30%, you need about 3.3. That is simple arithmetic, and it ignores overhead, so you need a cushion above it.
A published break-even MER table shows the same pattern:
| Gross margin | Break-even MER |
|---|---|
| 30% | 3.3 |
| 40% | 2.5 |
| 50% | 2.0 |
| 60% | 1.7 |
| 70% | 1.4 |
| 80% | 1.25 |
One analytics help article says a blended ROAS of 3x to 5x is generally considered healthy for direct-to-consumer ecommerce, and also notes that at 70% gross margins a 2x ROAS may be profitable, while at 30% a brand may need 5x or more. Use ranges like these as a starting point for your own break-even math, not as a target.
Why an average can mislead
A ROAS article from RoasChart gives a clear illustration. Meta returned 3.60x and Google 1.80x, giving a blended 3.10x that sounds reasonable. The store’s break-even was 3.32x, so the month actually lost $2,489, and Google alone was well under the floor. This is an illustrative example from one publisher, but the lesson holds: always check the blended figure against your own break-even, then look at each channel.
Common mistakes when calculating blended ROAS
The mistakes listed here come up again and again:
- Counting returns as revenue. Use net revenue after refunds.
- Mixing new and returning customers. Track new-customer revenue ÷ spend separately.
- Changing what counts as spend. Decide once, document it, and keep it.
- Reading a single day. Use a 7-day or 28-day window to smooth noise.
The second mistake deserves extra attention. One analytics vendor argues that returning customers can make blended ROAS look optimistic because they convert more readily and cost little to win again. A blended 4x can sit on top of a new-customer return far lower. The size of that effect varies by business, so measure your own split instead of assuming a figure.
How to use blended ROAS in practice
Here is a routine a small team can run each month without special software.
- Define your inputs. Choose net revenue from your store or accounting system and list exactly which spend lines count as “paid ad spend.”
- Calculate blended ROAS for the past 28 days and the prior 28 days.
- Compute your break-even using 1 ÷ gross margin, and mark it on the same chart.
- Split new and returning customer revenue and calculate new-customer revenue ÷ paid spend.
- Check each channel against its own break-even, using platform data for direction and blended data for the final word.
- Decide one change. Shift budget, fix a landing page or pause a campaign, then re-measure after a full cycle.
If you are deciding how to divide spend across channels, our guide to PPC budget allocation walks through the approach. For causal measurement beyond ratios, see our piece on marketing mix modeling and incrementality.
When blended ROAS drops
A falling number does not always mean ads got worse. Check, in order:
- Did revenue fall because of stock, pricing or seasonality?
- Did spend rise ahead of results that will arrive later, as in long sales cycles?
- Did tracking break, or did a platform change how it reports?
- Did your mix shift toward prospecting, which usually returns less in the short term?
Our guide on how to improve marketing efficiency covers the fixes once you know the cause.
Perspective: Treat blended ROAS as a starting line
We like blended ROAS because it forces an honest conversation. It starts with money that actually arrived, not with what a dashboard says it deserves credit for.
But we never let a client stop there. A single ratio compresses a lot of detail, so we pair it with break-even math, new-customer tracking and channel-level views. That is the thinking behind “Digital Beyond Tomorrow”: use data to see what is really happening, then act on it.
Our advice for most owners is simple. Pick a definition, write it down, review it monthly, and let it point you to the questions worth investigating. Strong measurement also supports our search, paid media and analytics work, because decisions get better when the numbers are trusted.
Hassan Bawab
Get a clearer read on your marketing returns
If your blended ROAS looks fine but growth feels stuck, or the platform numbers never match your books, a second pair of eyes helps. Our Marketing & Growth Systems team works with businesses on paid media, analytics and measurement. You can also talk with Magic Logix about where to start.
FAQ
What is blended ROAS?
Blended ROAS is total revenue divided by total paid ad spend for the same period. It combines every channel into one figure instead of relying on each platform’s own attribution. It shows overall efficiency, not which channel drove the sales.
What is the blended ROAS formula?
Total revenue (all channels) ÷ total paid ad spend (all channels). For example, $96,000 in net sales on $24,000 of Meta and Google spend gives 4.0, as in a published Shopify walkthrough. Use net revenue, and keep the same spend definition every month.
What is the difference between MER and ROAS?
ROAS measures the return on ad spend, either per campaign or blended across ads. MER divides total revenue by all marketing spend, including fees and other costs. Blended ROAS and MER use the same revenue, so the difference comes from the denominator.
Is a higher blended ROAS always better?
Not necessarily. A very high figure can mean you are only reaching people who already know you, or that growth is capped by low spend. Judge it against your break-even and your new-customer results, not on its own.
Sources
- Blended ROAS, Playad Docs
- Blended ROAS: Formula, Example and Why It Beats Platform ROAS, Admaxxer
- Blended ROAS: Formula, Examples and Why It Beats Platform ROAS, Karbon Analytics
- Blended ROAS vs MER: Formulas, Examples and When to Use Each, Circlify
- Platform ROAS vs Blended ROAS, Metric Hive
- Blended ROAS vs Channel ROAS: Which to Use When, Metricuno
- Marketing efficiency ratio, HubSpot
- What the Tech is marketing efficiency ratio (MER)?, The Current
- What Is MER in Marketing?, Pecan
- Understanding blended metrics, Datadrew
- Blended ROAS: What It Is, and What It Hides, RoasChart
- Why Blended ROAS Is Lying to You, Prooflytics
- How to Calculate Blended ROAS for Meta, Google and Shopify, ParseBase