

A workable ROI measurement framework has five parts: define ROI as profit, not revenue; set a baseline of what would have happened without the spend; pick the right metric for each decision (ROI, ROAS or marginal return); combine attribution, incrementality tests and marketing mix modeling; and report on a fixed cadence that finance trusts. The sections below walk through each part, with a worked example you can adapt.
Most teams don’t fail at ROI because they lack data. They fail because the word “ROI” gets used for three or four different things in the same meeting. A framework fixes that first.
TL;DR
- Marketing ROI is the profit attributable to a marketing investment divided by its cost. Revenue alone overstates the result, because it ignores margin and the sales that would have happened anyway.
- ROAS (return on ad spend) is a revenue-per-ad-dollar ratio. It is useful for day-to-day channel tuning, but it is not ROI.
- Use three lenses together: attribution for tactical decisions, incrementality tests for causal proof, and marketing mix modeling (MMM) for budget planning.
- Track marginal return (the return on the next dollar), not only the average, because returns diminish as spend rises.
- Agree on definitions, baselines and a reporting cadence with finance before the numbers are needed.
Table of Contents
- What marketing ROI actually measures
- ROI, ROAS and ROMI: which metric answers which question
- The five-part ROI measurement framework
- Building the model: a checklist
- Adapting the framework to your business type
- Common mistakes that distort ROI
- Our perspective
- Where Magic Logix can help
- FAQ
- Sources
What marketing ROI actually measures
The simplest version is familiar: take the gain, subtract the cost, divide by the cost. The part that gets skipped is what counts as “gain.” Guidance published by the American Marketing Association defines marketing ROI as the profit attributable to a specific marketing investment, not the revenue it touches. It also warns that ignoring the baseline, meaning what would have happened without the spend, leads to a significant overestimate of marketing’s impact.
An MIT Sloan Management Review article on using ROI correctly makes the same point from the finance side: to calculate ROI accurately, you need to estimate the fraction of profits attributable to the investment.
Two practical consequences follow:
- Use contribution margin, not revenue. A campaign that produces $100,000 in sales at a 40% margin produced $40,000 of gross profit before the campaign cost.
- Count the full cost. Media spend is only one line. Agency or contractor fees, creative production, software, and the internal time of your team belong in the denominator.
The same MIT Sloan and AMA discussion notes a common confusion: ROI gets used as a stand-in for any favorable outcome. A brand-awareness survey score, for example, can’t produce an ROI on its own, because it carries no cost-to-return link. It can still be a valuable leading indicator. Just don’t label it ROI.
ROI, ROAS and ROMI: which metric answers which question
These terms get swapped constantly. Here is a way to keep them apart.
| Metric | Formula (simplified) | Best for | Main blind spot |
|---|---|---|---|
| ROI | (Attributable profit – total cost) / total cost | Comparing marketing with other investments | Needs a defensible profit attribution and a baseline |
| ROAS | Revenue from ads / ad spend | Daily or weekly ad optimization | Ignores margin, non-media costs and incrementality |
| ROMI (return on marketing investment) | Incremental profit from marketing / marketing spend | Evaluating programs and budgets | Requires incrementality or modeling to estimate |
| Marginal ROMI | Return on the last dollar spent | Deciding whether to increase or cut a budget | Needs enough spend variation to estimate |
A worked example
The numbers below are illustrative, not client results.
A company spends $20,000 a month on paid search and reports $80,000 in attributed revenue. ROAS is 4.0. That looks healthy. Now apply a 35% gross margin: gross profit is $28,000. Add $4,000 a month in agency fees and creative, for a total cost of $24,000. ROI on the platform-reported numbers is ($28,000 – $24,000) / $24,000, about 17%.
Then run a holdout test and find that only 60% of those conversions were incremental, meaning the rest would have happened anyway. Incremental gross profit becomes $16,800, and ROI turns negative at about -30%.
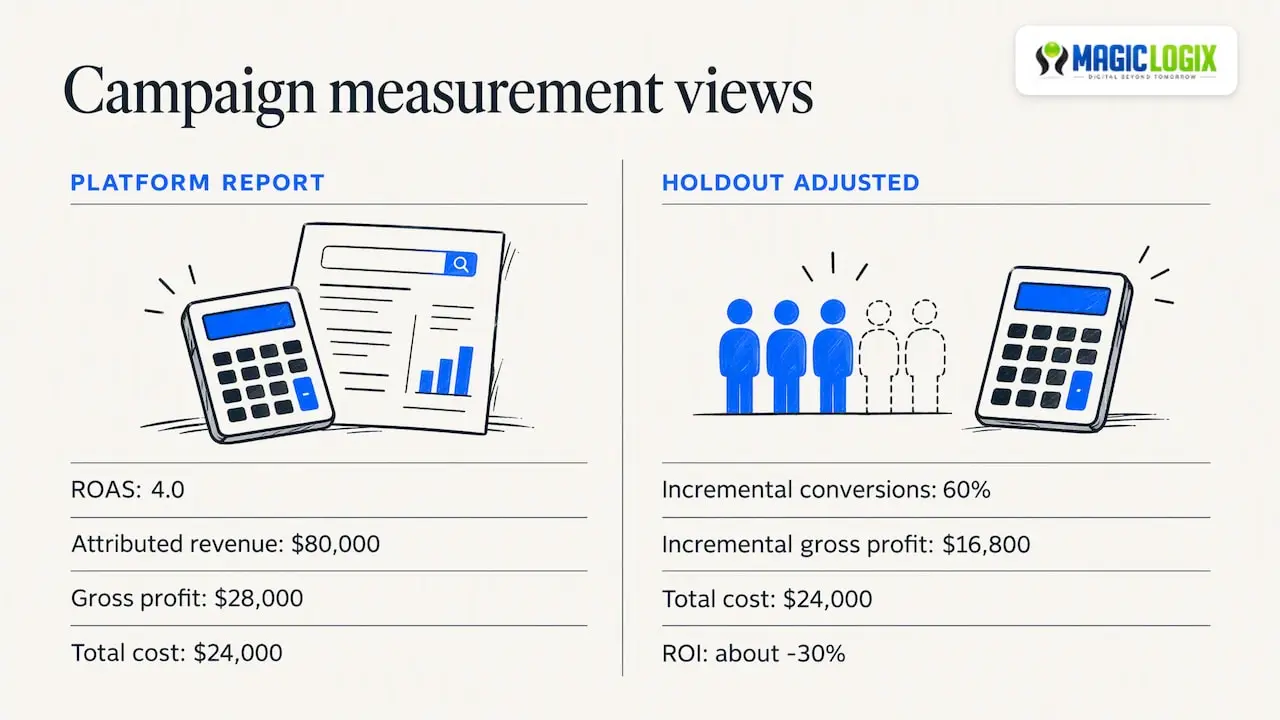
The same campaign supports three different stories depending on the metric. That is why the framework decides the definition before the report is built.
The five-part ROI measurement framework
1. Define the decision, then the metric
Start with the decision the number will support. Are you choosing between two channels, justifying next year’s budget, or deciding whether to keep a retainer? Each decision wants a different metric and a different time horizon.
The MIT Sloan Management Review’s essentials for marketing performance measurement puts aligning metrics with strategy first, and notes that in practice this step is often disconnected from metric selection. A short written definition sheet helps: for every metric, record the formula, the data source, the owner and the review period.
2. Set the baseline
A baseline is your best estimate of outcomes without the marketing in question. You can build one several ways:
- A holdout group that doesn’t see the campaign.
- A geographic split, with matched regions, one exposed and one not.
- A pre-period trend, which is the weakest option and works only when seasonality is stable.
Write down which method you used. A baseline you can’t explain will not survive a CFO’s first question.
3. Combine three measurement lenses
No single method is enough. The IAB’s State of Data 2026 report found that most U.S. buy-side decision-makers (67% to 76%) use at least one of three advanced approaches: incrementality tests, attribution analysis and marketing mix models.
Treat them as complementary:
| Lens | Question it answers | Cadence | Typical use |
|---|---|---|---|
| Attribution | Which touchpoints and paths precede conversion? | Continuous | Tactical optimization of campaigns, bids and creative |
| Incrementality tests | What would not have happened without this spend? | Per test, quarterly or around major budget moves | Validating channels and calibrating other models |
| Marketing mix modeling | How do channels and external factors drive outcomes over time? | Monthly to quarterly refresh | Annual budget planning and scenario work |
The split matters because attribution can over-credit channels that would have converted anyway, particularly branded search and retargeting. Incrementality is the check on that. If you want a deeper look at the modeling side, our guide to experiment-backed marketing mix modeling explains how test results can calibrate a model.
4. Look at marginal return, not just the average
The AMA guidance describes marketing response as an inverted-U shape: returns diminish as spend grows and can eventually turn negative. That means your average ROI can look great while the next dollar is nearly wasted.
Practically, that changes the question from “What is our ROI?” to “What would we earn on the next $10,000?” To estimate it:
- Vary spend in a controlled way, such as raising budgets 20% in matched markets.
- Measure the incremental profit change against the incremental spend.
- Move budget from channels with a low marginal return to those with a higher one, and re-test.
5. Report on a cadence finance trusts
Bain & Company argues that CFOs and CMOs need to work together to move past the view of marketing as a cost center, with a more customer-centric measurement model. Its emphasis on customer lifetime value (CLV) and incrementality, rather than short-term campaign outputs, is a good template for a shared scorecard.
A simple reporting rhythm:
- Weekly: ROAS, cost per acquisition, conversion rate, by channel.
- Monthly: contribution-margin ROI, pipeline or revenue influenced, spend against plan.
- Quarterly: incrementality test readouts, marginal return estimates, budget reallocation decisions.
- Annually: MMM refresh, CLV by acquisition channel, next-year scenarios.
Building the model: a checklist
Use this before you trust any ROI number.
- [ ] ROI is calculated on profit or contribution margin, not revenue.
- [ ] All costs are included: media, fees, creative, tools and internal time.
- [ ] A baseline method is documented.
- [ ] Conversions are deduplicated across platforms, since each ad platform may claim credit for the same sale.
- [ ] A time window is set that matches your sales cycle.
- [ ] At least one incrementality test has validated your largest channel.
- [ ] CLV is included where repeat purchases or contract renewals matter.
- [ ] Finance has reviewed and signed off on the definitions.
Adapting the framework to your business type
B2B and long sales cycles
Paid ROAS on a form fill says little when deals close six months later. Tie spend to pipeline stages and closed-won profit in your CRM, and use cohort views (leads created in a given month, tracked to revenue). For a fuller breakdown of the metric layer, see our pragmatic guide to digital marketing performance metrics.
Ecommerce and retail
Short cycles make testing easier. Margins vary by product, so calculate profit-based ROAS (the break-even ROAS is 1 divided by your margin; at a 40% margin it is 2.5). The U.S. International Trade Administration’s page on ecommerce key performance indicators is a helpful reference for the relationship between visitors, conversion and sales. If you also sell in stores, Google documents store visit conversion tracking for linking ads to physical visits, though you should treat it as one signal rather than proof of incremental sales.
Small businesses with limited data
You may not have the volume for MMM. That’s fine. Start with clean attribution, a simple profit-based ROI, and one or two geographic or time-based holdouts. Keep creative testing disciplined too: our approach to two-stage ad creative testing is built for teams working with modest conversion volume.
Teams investing in AI-driven marketing
Automation and AI tools add costs that rarely show up in a media report: setup, data cleanup, content review and monitoring. Include them. If you are measuring automation, compare the cost of the tool plus labor against hours saved or conversion lift, and set a review date. Our article on marketing automation cost covers why the total is often well above the sticker price. For predictive models specifically, see how we approach proving predictive marketing ROI.
Common mistakes that distort ROI
- Treating platform-reported revenue as truth. Each platform optimizes for its own credit.
- Using last-click as the only view. It rewards the channel nearest the sale.
- Ignoring margin. A 4.0 ROAS can lose money on a low-margin product.
- Calling every good outcome ROI. Survey lift, traffic and engagement are indicators, not returns.
- Measuring too early. Brand and content investments often pay back over quarters.
- Chasing one aggregate number. Average ROI hides diminishing returns.
- No operational owner. Someone has to own definitions and data quality. Our overview of what marketing operations does explains that role.
Our perspective
When owners ask us how to “prove ROI,” the real request is usually “help me defend this budget.” Those are different jobs. The first needs a method. The second needs trust, and trust comes from agreeing on definitions before the results arrive.
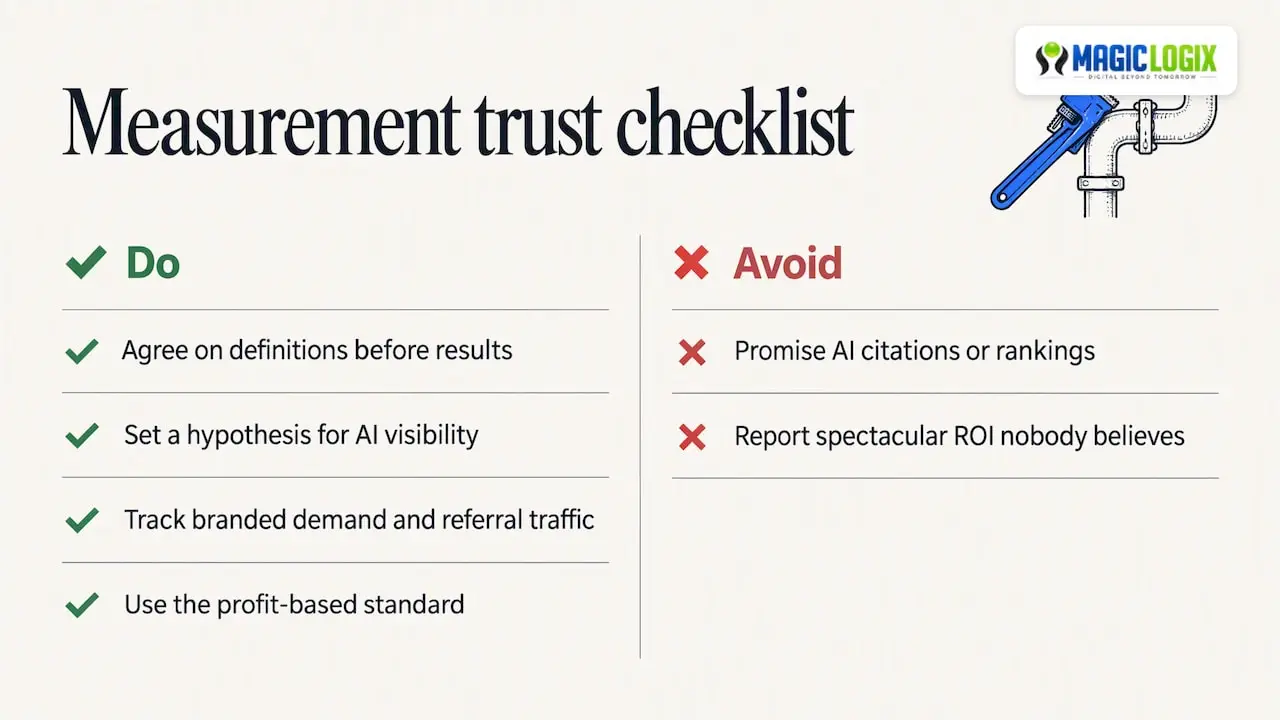
We’d rather see a team report a modest, well-supported ROI than a spectacular one nobody believes. Think of measurement like plumbing: when it’s built well, nobody notices it. When a joint is loose, every report leaks. We build for Digital Beyond Tomorrow, and that starts with measurement that still holds up when the platforms, the privacy rules or the AI answer engines change.
That applies to newer channels too. Visibility in AI-generated answers is still an evolving area, and no one can promise citations or rankings there. Treat it as a test-and-learn investment: set a hypothesis, track leading indicators such as branded demand and referral traffic, and judge it against the same profit-based standard as everything else.
— Hassan Bawab
Where Magic Logix can help
If your reporting is scattered across ad platforms, analytics and a CRM, the fastest win is usually a single measurement plan: definitions, baselines and a dashboard cadence. Our Marketing & Growth Systems work covers paid media management, analytics and automation under one plan, and our Search & AI Visibility services cover SEO and emerging answer-engine channels. If you want to see how measurement fits with search, start with our overview of AI search visibility. You can also read how we think about measuring digital marketing effectiveness before talking with us.
FAQ
What is the difference between ROI and ROAS?
ROAS divides ad-attributed revenue by ad spend. ROI divides attributable profit, net of all costs, by total cost. ROAS is quick for optimizing campaigns, while ROI is the better basis for budget decisions because it accounts for margin and non-media costs.
How do I calculate ROI on marketing spend?
Multiply incremental revenue by your gross margin to get incremental profit. Subtract total marketing cost, then divide by that cost. The word “incremental” matters: use a holdout, geo test or model to estimate what would have happened without the spend.
What is the difference between ROI and a KPI?
ROI is one financial result that compares return with cost. A KPI is any metric you’ve chosen to track progress, such as conversion rate or qualified leads. Good KPIs act as leading indicators that you connect to ROI over time.
Do small businesses need marketing mix modeling?
Usually not at first. MMM needs enough history and spend variation across channels to be reliable. Most small businesses get more from clean attribution, a profit-based ROI and a couple of well-designed holdout tests.
Sources
- Using Return on Marketing Investment Effectively, American Marketing Association (2024)
- Are You Using the Return on Investment Metric Correctly?, MIT Sloan Management Review (2016)
- Five Essentials for Marketing Performance Measurement Systems, MIT Sloan Management Review (2024)
- IAB State of Data 2026 report
- A New CFO-CMO Collaboration Paradigm, Bain & Company
- eCommerce Key Performance Indicators, International Trade Administration
- About store visit conversions, Google Ads Help