

Marketing mix modeling (MMM) is a statistical method that quantifies how your marketing activities and external factors drive sales, giving you a data-based path to reallocate budget and forecast results under different spending scenarios. Its core value is straightforward: it separates what would have happened anyway from what your campaigns actually caused. The typical output package includes channel contribution estimates, response curves showing where each channel saturates, and marginal incremental ROAS figures you can act on directly.
TL;DR:
- MMM provides a comprehensive view of how both online and offline marketing channels contribute to sales, even with limited user-level data.
- Regular in-market experiments and quarterly recalibrations are essential to validate and enhance the accuracy of the model’s estimates.
- Cost and scope heavily influence MMM project budgets, with data quality and validation scope being the primary drivers of expense.
- MMM outputs, especially marginal ROAS and response curves, offer actionable insights into diminishing returns and optimal spend levels for specific channels.
- Combining MMM with attribution models and maintaining transparent documentation increases confidence in marketing decisions and long-term budget authority.
Table of Contents
- Why Marketing Mix Modeling Matters for Marketers and Executives
- How MMM Works: Model Components and Common Statistical Techniques
- Key Outputs and Metrics from MMM and How to Interpret Them
- Data Requirements and a Data-Prep Checklist
- How to Implement MMM: Step-by-Step Operational Roadmap
- Limitations and Common Pitfalls in Marketing Mix Modeling
- MMM vs Attribution: What Each Answers and How to Use Them Together
- How Magiclogix Operationalizes Marketing Mix Modeling
- Cost Considerations and Typical Budgets for MMM Projects
- Priorities for MMM Programs Going Into 2026
- Let Magiclogix Build Your Measurement Backbone
- Sources
- FAQ
Why Marketing Mix Modeling Matters for Marketers and Executives
Every CMO eventually faces the same question from the board: “If we had $2 million more, where would it go, and what would we get back?” Gut instinct and last quarter’s dashboard rarely answer that convincingly. Marketing mix modeling does, because it puts a number on what each channel contributed to sales after stripping out seasonality, pricing moves, and competitive noise.
The practical value shows up in three places. First, budget allocation: instead of funding channels based on who shouts loudest in the planning meeting, you fund the ones with the strongest marginal return at your next dollar of spend. Second, forecasting: once you know how sales respond to spend changes, you can model next quarter’s outcome under different budget scenarios before you commit a dollar. Third, executive communication: a well-calibrated model gives you a shared language with finance, since it speaks in incremental revenue and ROI rather than impressions or clicks.
There’s a structural reason MMM has become more relevant, not less, over the past few years. Because it works from aggregated, channel-level and market-level data rather than individual user signals, it keeps functioning as cookie deprecation and platform-level tracking restrictions erode user-level attribution. Harvard Business Review has described this aggregate-data approach as a resilient standard for measuring ad effectiveness precisely because it doesn’t depend on the identifiers that regulators and browsers are steadily removing.
MMM tends to answer strategic questions that channel-level dashboards cannot:
- How much of this quarter’s sales lift came from marketing versus a competitor stumbling or a price cut?
- What happens to total revenue if we shift 15% of TV spend into paid social?
- At what spend level does a channel stop paying back at an acceptable rate?
- How do brand campaigns affect performance channels weeks later, not just in the week they run?
Statistic to know: Robust MMM programs increasingly pair the model with periodic in-market experiments rather than treating the model as a one-off report, according to the MMA’s analytics framework — a shift that turns MMM from an annual research exercise into an operating input for planning.
None of this replaces click-level optimization. It gives you the altitude that click-level data structurally can’t provide: a view of the whole mix, including offline channels, at once.
How MMM Works: Model Components and Common Statistical Techniques
Underneath the dashboard, MMM is regression analysis with marketing-specific adjustments layered on top. You’re explaining a dependent variable, usually sales, revenue, or store visits, using a set of independent variables that represent your marketing activity and everything else that could plausibly move the outcome.
The variables you’re actually modeling
The dependent variable is your outcome metric measured weekly (sometimes daily for high-velocity categories). The independent variables split into two buckets: marketing variables (spend or activity by channel: TV, paid search, social, out-of-home, email, promotions) and control variables that account for everything marketing doesn’t influence directly. Coursera’s overview of the 4 Ps framework (product, price, place, promotion) is a useful mental model for scoping which controllable factors belong in a model, since price changes and distribution shifts often explain more variance than any single ad channel.
Controls typically include:
- Seasonality (holidays, weather, back-to-school cycles)
- Pricing and promotional activity
- Distribution or store-count changes
- Competitor activity where you can proxy it
- Macroeconomic indicators (consumer confidence, unemployment, category growth)
Adstock and saturation: the two transforms that make MMM work
Raw ad spend rarely explains sales well on its own, because two effects distort the relationship. Adstock captures carryover: a TV ad seen this week still influences purchases two or three weeks out, decaying gradually rather than dropping to zero. Saturation captures diminishing returns: doubling your paid search budget doesn’t double the sales it generates, because you exhaust high-intent searchers and start paying for progressively less valuable clicks.

Modelers apply adstock and saturation transforms to raw spend before running the regression, which is why MMM output looks nothing like a simple correlation between spend and sales. Wikipedia’s summary of marketing mix modeling describes this decomposition process well: sales get split into baseline and incremental components, with adstock and saturation curves shaping how each channel’s incremental contribution behaves over time and volume.
Estimation methods: from ordinary regression to Bayesian MMM
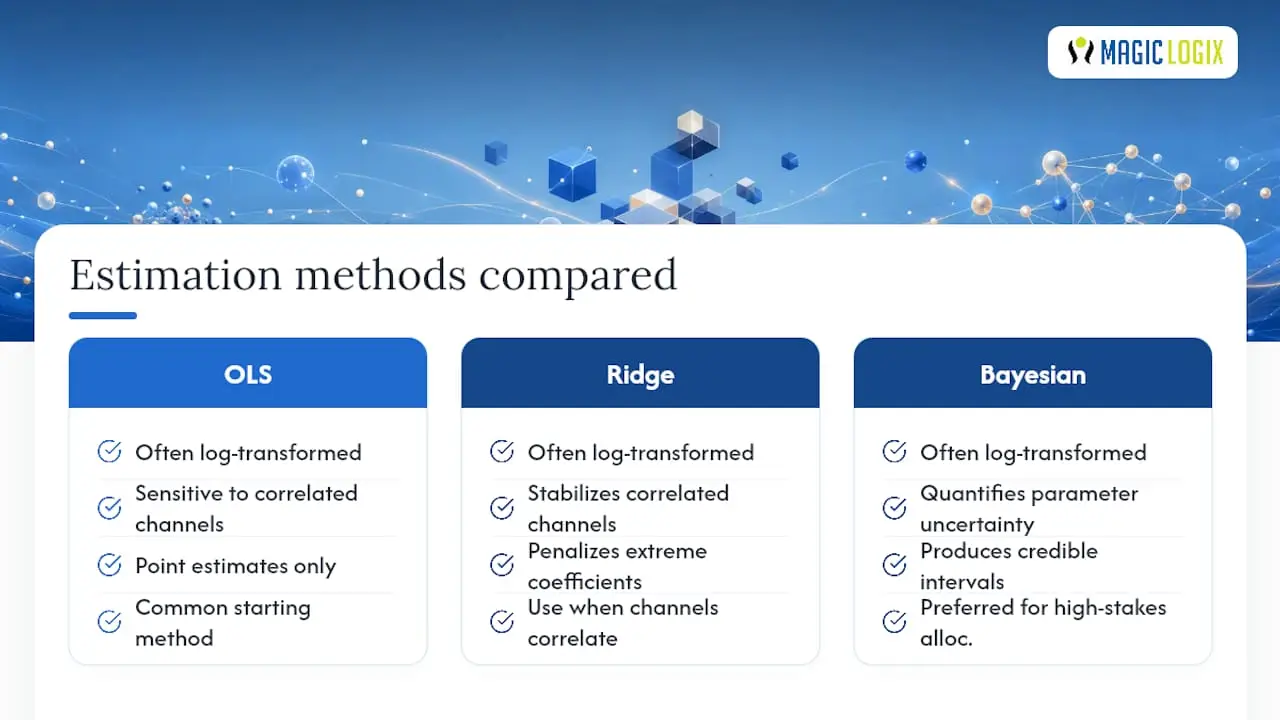
Most MMM builds start with ordinary least squares (OLS) regression, often on log-transformed variables so the coefficients read as elasticities (a percentage change in spend produces a percentage change in sales). When channels are correlated with each other, which is common when TV and digital campaigns launch together, ridge regression helps stabilize coefficient estimates by penalizing extreme values.
Bayesian MMM has become the preferred approach for teams making high-stakes allocation calls, because it produces credible intervals around every estimate instead of a single point number. That distinction matters practically: a marginal ROAS estimate of “2.1, with a credible range of 1.6 to 2.8” tells you far more about how confidently to act than a bare “2.1” ever could. Wikipedia’s technical overview of MMM methodology notes that Bayesian variants help quantify this parameter uncertainty directly, which matters when you’re deciding whether to shift millions in spend based on the output.
Pro Tip: Ask any vendor proposing an MMM build whether they’re running frequentist OLS or Bayesian estimation, and ask to see the confidence or credible intervals on the channel you care about most. A model that reports point estimates with no uncertainty range is hiding information you need before you reallocate budget.
Cross-channel interactions add another layer of complexity. Brand advertising can lift the effectiveness of paid search by increasing branded search volume, and a well-specified model accounts for that instead of crediting search alone. Seasonality gets handled through either explicit seasonal dummy variables or, in more advanced builds, a smooth trend component that separates long-run growth from short-term seasonal swings.
Key Outputs and Metrics from MMM and How to Interpret Them
The value of an MMM build lives or dies on whether marketers can actually read the outputs. Four deliverables matter more than the rest.
Baseline versus incremental decomposition splits your total sales into what would have happened with zero marketing (baseline, driven by brand equity, distribution, and habitual repeat purchase) and what marketing actually added (incremental). A mature brand might see a baseline majority of sales from brand equity and habitual purchases, which surprises executives who assume marketing is doing more heavy lifting than it is.
Channel contribution percentage breaks the incremental portion down by channel, showing which activities generated the sales lift. This is the number that ends up in board decks, and it’s also the most frequently misread one: a channel with a large contribution percentage isn’t necessarily the best place to add the next dollar.
That’s where response curves matter. A response curve plots incremental sales against spend for each channel, and its shape shows exactly where diminishing returns kick in. A channel can have modest total contribution but still be underfunded, sitting on the steep part of its curve where the next dollar spent generates strong returns. Our guide to measuring digital marketing effectiveness walks through how contribution metrics translate into budget conversations with finance teams.
Marginal incremental ROAS (miROAS) is the metric that should actually drive allocation decisions, since it estimates the return on the next dollar rather than the average return across all dollars already spent. A channel can show a strong average ROAS of 4.0 while its marginal ROAS at current spend has fallen to 1.2, meaning you’re already overspending it.
A few statistical fit checks tell you whether to trust any of these numbers:
- R squared, which shows how much variance in sales the model explains (values above 0.80 are common in well-specified consumer models)
- MAPE (mean absolute percentage error), which measures average forecast accuracy out of sample
- Elasticity coefficients, which express how a 1% change in spend moves sales, and which should hold up when tested against a holdout period
Statistic to know: The MMA’s framework for marketing analytics treats out-of-sample validation and in-market experiment calibration as the deciding factor between a model that’s statistically fit and one that’s actually trustworthy for budget decisions. A high R squared with no experiment calibration is a warning sign, not a green light.
Data Requirements and a Data-Prep Checklist
MMM is only as good as the history you feed it, and most failed projects trace back to data gaps discovered midway through the build rather than any modeling error.
The standard recommendation is 18 to 24 months of weekly data at minimum, since anything shorter struggles to separate seasonal patterns from genuine marketing effects. CACI’s overview of MMM notes that enterprise implementations often stretch to five years of history specifically to sharpen seasonality and long-run trend detection, which matters more for categories with strong annual cycles like retail or travel.
Before a model build starts, run through this checklist:
- Outcome data. Weekly sales, revenue, or conversions at the granularity you’ll report on, ideally with regional or market-level splits if you plan to model geography.
- Channel spend and activity. Weekly spend by channel, plus impressions or GRPs where available, since spend alone misses reach and frequency shifts.
- Pricing and promotion records. Every price change, discount period, and promotional calendar entry, since these frequently explain sales swings that would otherwise get misattributed to media.
- Distribution and availability. Store count, stockouts, or e-commerce site changes that affected how many customers could buy at all.
- External controls. Competitor activity proxies, category growth rates, and macroeconomic indicators relevant to your category.
- Alignment check. Every data source mapped to the same weekly calendar, since a channel reporting on a Sunday to Saturday week against sales reported Monday to Sunday will quietly corrupt your estimates.
- Collinearity review. A correlation matrix across channels to flag campaigns that launched together and will be statistically hard to separate.
Pro Tip: Run a missing-data audit before you commit to a model timeline. A single quarter with a broken spend feed from one channel can force you to either drop that period entirely or use imputation, and either choice changes your final coefficients. Catch it in week one, not week eight.
Timelines vary by scope. A single-brand model with clean, centralized data typically runs 6 to 10 weeks from data freeze to first validated output. Enterprise builds spanning multiple brands, markets, or business units, especially ones layering in Bayesian estimation and geo-level splits, commonly run 12 to 20 weeks, with most of that time going to data reconciliation rather than the modeling itself.
How to Implement MMM: Step-by-Step Operational Roadmap
Running or briefing an MMM engagement well means treating it as a project with defined stages, not a black box you hand off and wait for. The MMA’s framework for a complete MMM program breaks the work into four broad stages, which map onto a more detailed operational sequence:
- Define scope and objectives. Decide the outcome metric, the granularity (national, regional, brand-level), and the decisions the model needs to support. A model built to justify next year’s TV budget looks different from one built to optimize weekly digital pacing.
- Collect and clean data. Pull the full dataset described in the checklist above, align calendars, and document every assumption about how spend or activity was categorized.
- Engineer variables. Apply adstock and saturation transforms, build seasonal and trend components, and decide how granular to go on channel splits (aggregate “digital” versus separate paid search, social, and display).
- Specify and estimate the model. Choose OLS, ridge, or Bayesian estimation based on how many correlated channels you’re dealing with and how much uncertainty quantification matters for your decisions.
- Run diagnostics. Check R squared, residual patterns, and coefficient signs against business logic. A model showing negative contribution from a channel you know drove sales usually signals a specification problem, not a real finding.
- Cross-validate. Hold out the most recent 8 to 12 weeks, refit on the remaining history, and check whether the model predicts the holdout period within an acceptable MAPE range.
- Validate against in-market experiments. This is the step too many programs skip. Geo-holdout tests or incrementality experiments on your largest channel give you an independent check on whether the model’s contribution estimate matches reality.
- Build scenario plans. Use the validated response curves to simulate budget shifts, feeding “what if we moved $500,000 from display to connected TV” questions directly into the model rather than guessing.
- Hand off to media planning. Translate the optimized allocation into actual flight plans and pacing targets, and set a refresh cadence so the model doesn’t go stale.
A few operational habits separate teams that get real value from this process from teams that produce a report nobody uses:
- Involve media planners in variable definition early, since they know which campaigns actually launched together and which “single channel” spend line secretly covers three different tactics.
- Document every transform and assumption in a model card that survives staff turnover.
- Set a recalibration trigger (a major strategy shift, a new channel launch, or simply a fixed quarterly cadence) rather than letting the model run unchanged for years.
- Push scenario outputs into the actual planning tools your team uses weekly, not just an annual slide deck.
Our piece on digital marketing predictive analytics goes deeper into how forecasting outputs like these get built into ongoing planning cycles rather than one-time exercises.
Limitations and Common Pitfalls in Marketing Mix Modeling
MMM is powerful, and it’s also easy to misuse if you don’t respect its constraints. The biggest structural limitation is granularity: because MMM works on aggregated weekly or monthly data, it can’t tell you which specific ad, creative, or audience segment within a channel drove results. That’s a job for attribution and platform-level testing, not MMM.
A few recurring failure modes show up across programs:
- Multicollinearity from simultaneous launches. When TV, social, and email campaigns all go live the same week, the model struggles to credit each one separately, and coefficients become unstable.
- Overfitting to a short history. A model tuned too tightly to 12 months of data can look impressive on paper and fall apart the moment a new season or economic shift arrives.
- Confounding events. A competitor’s stockout, a viral moment unrelated to your campaigns, or a supply disruption can masquerade as a marketing effect if it isn’t captured as a control variable.
- Data gaps that quietly break inference. A missing quarter of spend data, or a channel that changed its reporting definition mid-history, can shift every coefficient in the model without an obvious warning sign.
The mitigation for nearly all of these is the same: periodic in-market experiments. Geo-holdouts and incrementality tests act as a reality check against the model’s assumptions, and HBR’s analysis of modern ad measurement treats this experiment-model pairing as the difference between MMM as a credible measurement system and MMM as an educated guess with a regression attached.
MMM vs Attribution: What Each Answers and How to Use Them Together
The question “should we use MMM or attribution” is the wrong framing, since the two measure different things at different altitudes. MMM works top down, starting from total sales and decomposing what drove them across the entire mix, including channels attribution can’t see at all, like TV, out-of-home, and offline retail. Multi-touch attribution works bottom up, tracking individual user touchpoints to credit specific campaigns, creatives, or keywords.
That structural difference decides which tool answers which question:
- Use MMM for strategic budget setting: how much should go to TV versus digital versus retail media this year.
- Use attribution for tactical, in-channel optimization: which search campaign, ad set, or creative within paid social is performing best right now.
- Use MMM when privacy restrictions or walled gardens have degraded attribution’s user-level visibility.
- Use attribution when you need weekly or daily granularity that MMM’s data cadence can’t provide.
Statistic to know: Terminology sometimes confuses newer practitioners, since econometric modeling literature treats econometrics as the broader academic discipline, while MMM is the applied version of those techniques focused specifically on channel attribution and marketing budget decisions. They’re related, not identical, and knowing the distinction helps when a vendor uses the terms interchangeably in a pitch.
The strongest programs don’t pick one. They calibrate attribution data as an input into the MMM build, use in-market experiments to validate both systems against the same ground truth, and align refresh cadences so a monthly MMM update and a weekly attribution read aren’t quietly telling conflicting stories to different stakeholders.
How Magiclogix Operationalizes Marketing Mix Modeling
Magiclogix approaches MMM as an iterative measurement system, not a one-time deliverable. That distinction shapes every stage of the work: models get built, calibrated against real business outcomes, tested with in-market experiments where the budget allows, and refreshed on a cadence that keeps pace with how fast a client’s media mix actually changes.
Across more than 35,000 projects delivered for businesses ranging from small operators to enterprise brands, one pattern holds consistently: the models that earn trust from finance and leadership are the ones built with heavy input from people who actually run the campaigns, not the ones built in isolation by a data team. Practitioner experience backs this up directly:
High-quality marketing mix modeling depends on business context and iterative calibration as much as on statistical technique. Models calibrated against real experiments and business outcomes consistently outperform more complex models that skip that step, based on practitioner analysis of MMM in applied settings.
If you’re briefing a prospective measurement partner, whether that’s Magiclogix or anyone else, a few questions separate a serious proposal from a template:
- What’s the estimation method, and will you see credible or confidence intervals on every channel coefficient?
- How will the model be validated: cross-validation only, or in-market experiments too?
- What’s the refresh cadence once the initial model is live?
- What does the actual deliverable look like: a static report, or a scenario tool your team can query directly?
Expect a scoping conversation before any modeling starts, a data audit against the checklist covered earlier in this guide, and a validation plan that names specific experiments rather than promising vague “ongoing testing.” Our guide to media planning examples shows how these outputs typically flow into actual flight plans once the model is live.
Cost Considerations and Typical Budgets for MMM Projects
MMM pricing scales with data complexity and scope far more than with the sophistication of the statistics involved. A single-brand model using a handful of channels and centralized, clean data represents the lower end of the market. Enterprise engagements covering multiple brands, geographies, or business units, especially ones incorporating Bayesian estimation and ongoing quarterly recalibration, sit meaningfully higher, largely because of the data reconciliation labor rather than the modeling itself.
Three factors drive most of the cost variance you’ll see in vendor proposals. Data readiness matters most: a client with clean, centralized weekly data across all channels pays far less than one whose spend data lives across six disconnected platforms and needs months of reconciliation before modeling can even start. Validation scope matters next, since adding in-market experiments (geo-holdouts, incrementality tests) to validate the model’s claims adds real cost but also real credibility. Refresh cadence is the third lever: a one-time annual model costs less than a program that recalibrates quarterly and feeds a live scenario-planning tool.
Rather than budgeting around a single number, ask any vendor to break the proposal into distinct line items: initial data audit and cleaning, model build and estimation, validation and experiment design, and ongoing refresh cadence. That breakdown tells you where your money is actually going and where you have room to phase the work if the full scope doesn’t fit this year’s budget. Our overview of marketing agency pricing models covers how retainer and project-based engagements typically get structured for analytics work like this.
Priorities for MMM Programs Going Into 2026
The biggest shift underway is the move from annual MMM reports to always-on models with faster refresh cycles. A model recalibrated quarterly, or even monthly for fast-moving categories, catches shifts in channel effectiveness that an annual build misses entirely. That cadence change is the single highest-leverage investment most measurement teams can make right now, ahead of adding more channels or more statistical complexity.
Experimental validation deserves the second priority slot, and not as a nice-to-have. A model without periodic in-market calibration is a hypothesis, not a measurement system, and CFOs increasingly know the difference. Pair every major reallocation decision with a plan to validate it, even a modest geo-holdout, rather than treating the model’s word as final.
Governance is the piece most programs still underinvest in. That means documenting every transform and assumption so the model survives team turnover, giving stakeholders outside the analytics team direct access to scenario outputs rather than a static annual deck, and being honest about confidence intervals instead of presenting point estimates as certainty. The programs that earn lasting budget authority are the transparent ones, not the most technically elaborate ones.
— Hassan
Let Magiclogix Build Your Measurement Backbone
Building an MMM program in-house means hiring statisticians, sourcing clean historical data across every channel, and running validation experiments most internal teams have never designed before. Magiclogix handles that full stack as an engagement, not a one-off report, pairing model builds with the media execution and analytics work needed to act on what the model finds.

Clients typically get a validated contribution model, response curves by channel, and a scenario-planning framework tied directly into ongoing campaign management, so the insight doesn’t sit in a slide deck while budgets keep getting set the old way. That combination of measurement and execution under one team is the practical advantage over hiring a pure analytics vendor and a separate media agency and hoping their timelines align.
If you’re ready to see what a calibrated model would say about your current mix, start with a scoping conversation around our predictive analytics services or explore how measuring digital marketing effectiveness connects directly to the budget decisions your leadership team is asking about this quarter.
Sources
- What is Marketing Mix Modeling? | MMA (Institute for Marketing and Analytics)
- What is Marketing Mix Modelling (MMM)? | CACI
- A new gold standard for digital ad measurement | Harvard Business Review
- Marketing mix modeling – Wikipedia
- Econometric modelling for marketing in 2026 | Linea Analytics
FAQ
Is MMM the Same as Econometrics?
Not exactly. Econometrics is the broader academic field applying statistical methods to economic data, while MMM is the applied version focused specifically on channel attribution and marketing budget decisions.
What Are the 4 Ps of the Marketing Mix Model?
The 4 Ps are product, price, place, and promotion, and they represent the controllable variables that MMM commonly incorporates alongside media spend when explaining sales performance.
How Do You Build a Marketing Mix Model?
You define the outcome metric and scope, gather 18 to 24 months of weekly data across channels, pricing, and controls, engineer adstock and saturation transforms, estimate the model using OLS or Bayesian methods, then validate it with holdout testing and in-market experiments before using it for budget scenarios.
How Is MMM Different From Multi-Touch Attribution?
MMM works top down from aggregate sales to estimate overall channel contribution, including offline channels, while multi-touch attribution works bottom up from individual user touchpoints; the strongest measurement programs use both together rather than choosing one.