Customer journey analytics is all about connecting the dots. It’s the process of tracking and analyzing every single interaction a customer has with your business over time. Instead of just seeing isolated events, like a single website visit or one opened email, it reveals the complete story of their path from awareness all the way to purchase and beyond.
This approach gives you a single, unified view of customer behavior, no matter which channel they’re using.
Decoding the Customer Journey Story
Think of your traditional analytics reports as a stack of disconnected photographs. One photo shows a customer on your homepage. Another captures them opening an email. A third shows a support ticket they submitted. Each picture is useful on its own, but you’re missing the actual story that ties them all together.
What is customer journey analytics? It’s the tool that stitches those photos together into a coherent film, showing you exactly how and why a customer moved from one scene to the next.
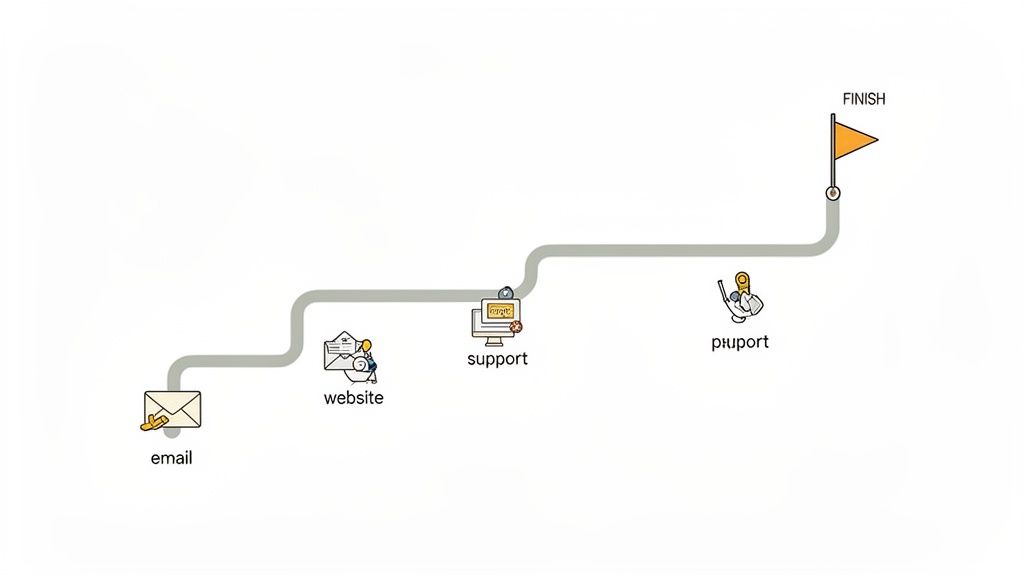
This holistic view is absolutely essential because modern customer paths are anything but a straight line. Someone might see a social media ad, visit your website, sign up for a newsletter, and then disappear for weeks before coming back through a search ad to finally make a purchase. Without journey analytics, trying to credit that final sale to a single touchpoint is nearly impossible—and often flat-out wrong.
Why Journey Analytics Is Gaining Momentum
The big shift toward this kind of analysis reflects a major change in how businesses think about growth. Companies are finally realizing that understanding the entire journey is the key to unlocking sustainable success. The numbers back this up, with the customer journey analytics market surging from $8.3 billion in 2020 to a projected $25.1 billion by 2026.
This explosive growth is fueled by real results. Businesses that use these insights report up to 30% higher customer retention rates simply because they can pinpoint friction points and personalize experiences that actually matter. You can explore more about the market's growth and impact on MarketsandMarkets.com.
For a clearer picture, here’s a quick breakdown of the core components.
Customer Journey Analytics at a Glance
This table simplifies the main pillars of customer journey analytics, showing how each piece contributes to a smarter business strategy.
| Component | Description | Business Goal |
|---|---|---|
| Data Collection | Gathering raw interaction data from all touchpoints (website, email, social, CRM, etc.). | Create a single, comprehensive view of every customer interaction. |
| Identity Resolution | Stitching together data from different channels to recognize an individual customer. | Understand a single user's behavior across multiple devices and platforms. |
| Journey Visualization | Mapping the sequence of touchpoints to visualize common customer paths. | Identify the most (and least) effective paths to conversion and retention. |
| Attribution Modeling | Assigning credit to different touchpoints that influence a conversion. | Optimize marketing spend by investing in the most impactful channels. |
| Predictive Analytics | Using historical data to forecast future customer behavior, like churn or purchase intent. | Proactively engage customers to improve retention and lifetime value. |
Ultimately, each of these components works together to turn messy, disconnected data into a clear roadmap for improving the customer experience.
This approach empowers you to finally answer the big questions that siloed data can't touch:
- Which marketing channels actually work together to create high-value customers?
- Where do potential buyers drop off most frequently in their journey?
- What sequence of interactions leads to the highest customer lifetime value?
- How can we proactively spot at-risk customers before they churn?
By connecting cross-channel data, journey analytics moves beyond simply reporting on what happened to explaining why it happened. This deeper understanding is what separates industry leaders from the competition.
Moving Beyond Simple Metrics
At the end of the day, the goal here is to shift from reactive problem-solving to proactive experience optimization. It allows you to identify the "golden paths" that your best customers take and find ways to guide others along those same successful routes.
Just as importantly, it shines a bright light on the roadblocks and friction points that are quietly costing you revenue, giving you the data you need to make smart improvements. This strategic insight helps you build a more seamless, intuitive, and satisfying experience that not only brings in new customers but also builds the kind of loyalty that lasts.
It's about seeing the whole forest, not just a handful of trees.
The Three Pillars of a Powerful Analytics Engine
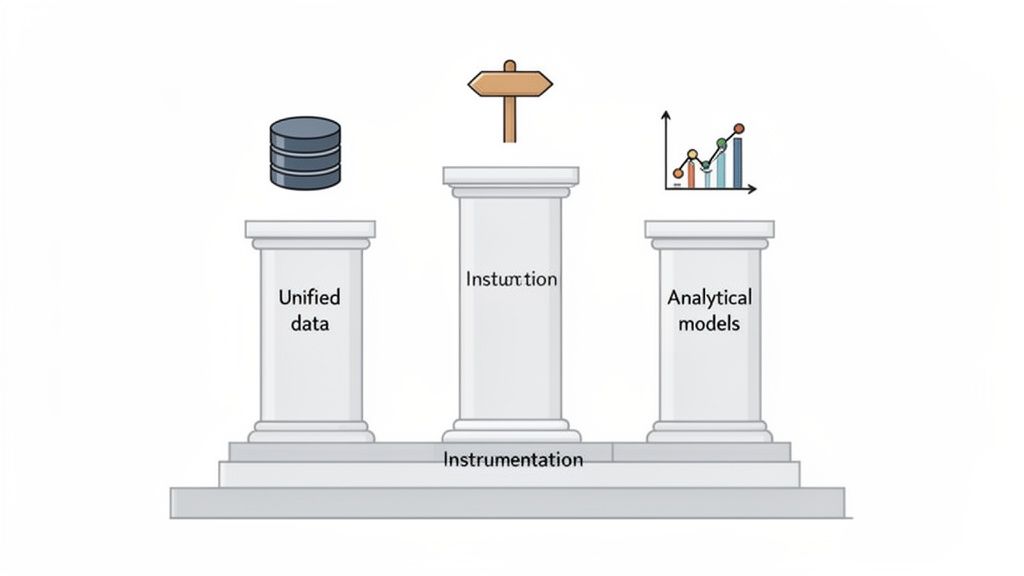
To really get a handle on the customer journey, you need more than a mountain of raw data; you need a solid, dependable engine to make sense of it all. This engine stands on three crucial pillars that work in tandem to transform disconnected data points into strategic intelligence.
If any one of these pillars is wobbly, your whole analytics structure becomes unstable. The result? Incomplete insights and a lot of missed opportunities. Let’s look at what holds this whole thing up.
Pillar 1: Unified Data Sources
The first and most foundational pillar is unified data. Think about trying to complete a puzzle, but the pieces are from three different boxes. You’ll never see the whole picture. That’s exactly what happens when your customer data is trapped in separate, disconnected systems—what we call data silos.
Your CRM knows a customer’s sales history, your e-commerce platform tracks their purchases, and your support desk has a record of their service tickets. By themselves, each system tells just one small part of the story. Unified data is what brings all those puzzle pieces to the same table.
By pulling together data from every single touchpoint, you create one complete, 360-degree view of each customer. This includes:
- Behavioral Data: Website clicks, app usage, and content downloads.
- Transactional Data: Purchase history, cart abandonment, and subscription changes.
- Engagement Data: Email opens, social media interactions, and webinar attendance.
- Support Data: Helpdesk tickets, live chat logs, and customer feedback surveys.
Only when you bring these sources together can you start mapping the winding, cross-channel paths your customers are actually taking.
Pillar 2: Precise Data Instrumentation
With your data sources connected, the next pillar to put in place is precise data instrumentation. Think of this as adding clear signposts and mile markers along your customer highways. It's the technical job of tagging and tracking specific user actions to make sure every important interaction gets captured accurately.
Without the right instrumentation, your data becomes noisy and unreliable. For instance, if you don't correctly track a "demo requested" button click, you’ll have no idea how many high-intent leads that blog post is really generating.
Effective instrumentation is the difference between having a lot of data and having the right data. It ensures your analytics are based on clean, consistent, and meaningful signals from every stage of the journey.
This step is all about defining which events actually matter to your business—like form submissions, key feature usage, or content shares—and then putting the tracking codes in place to record them. This detailed tracking turns raw activity into structured events that you can finally analyze for patterns.
Pillar 3: Intelligent Analytical Models
The final pillar is where all that raw, instrumented data becomes actionable insight. This happens through intelligent analytical models. These are the algorithms and frameworks that sift through your unified data to spot patterns, assign value, and predict what’s going to happen next. They are, quite simply, the "brains" of your analytics engine.
These models go way beyond simple reporting to answer your most complex business questions. Two common types are:
- Attribution Models: These models figure out which touchpoints deserve credit for a conversion. Instead of foolishly giving 100% of the credit to the very last click, multi-touch attribution models spread it across the entire journey, showing you what’s truly influencing your customers.
- Predictive Models: Using historical data, these models forecast future behavior. A predictive scoring model, for example, can flag which leads are most likely to convert or which customers are at risk of churning, letting you step in before it's too late.
Applying these models shifts you from just looking backward at what happened to looking forward at what will happen next. This level of insight is absolutely crucial for making smart, strategic decisions. If you want to dig deeper into the tools for this kind of work, there’s a helpful business intelligence software comparison on MagicLogix.com that explores different options.
How To Map The Customer Path With Key Metrics
Once your data is unified and you have precise tracking in place, you can finally shift from theory to practice. This is where the real fun begins—mapping customer behavior to find the stories hidden in the data. Think of it like a city planner studying traffic patterns to optimize flow, prevent jams, and build more efficient routes.
Instead of just hoarding data, you'll start using specific analytical methods to ask—and answer—the big business questions. Where do your best customers really come from? At what exact stage do potential buyers just give up? These methods give you the framework to turn raw data into a strategic roadmap for growth.
Core Journey Analysis Methods
To make sense of the complex movements of your customers, you need a few core analytical techniques in your toolkit. Each one offers a different lens to view the journey through, revealing unique patterns and opportunities.
For our city planner, this is like having separate maps for traffic volume, rush hour hotspots, and common accident sites. Each map tells a part of the story.
Three of the most powerful methods are:
- Path Analysis: This method visually maps the most common sequences of actions customers take. It answers the question, "What are the typical routes people follow on their way to converting or dropping off?"
- Funnel Analysis: Here, you define a specific, ideal path—like a checkout process—and measure how many users complete each step. This is perfect for pinpointing exactly where friction is causing people to abandon a critical process.
- Cohort Analysis: This technique groups users based on a shared characteristic, usually when they first started using your product. It helps you see how behavior and retention change over time for different customer groups.
These methods work in concert to give you a multi-dimensional view. A huge part of understanding the customer journey is getting comfortable with robust data analysis. Mastering areas like marketing campaign analytics is key to making sense of performance across all your touchpoints.
Focusing On Metrics That Matter
When you start mapping journeys, you'll be swimming in data. The trick is to ignore the noise and focus on the metrics that directly reflect business health. Vanity metrics like total page views or social media likes can be seriously misleading. You need to concentrate on data points that measure real value and momentum.
For instance, path analysis might show that customers who watch a product demo video are 50% more likely to convert. That's a clear, actionable insight. Funnel analysis could reveal a massive 70% drop-off between adding an item to the cart and completing the purchase, pointing to an obvious problem in your checkout flow.
The goal of customer journey analytics isn't just to see the path, but to measure its value. By connecting specific actions to business outcomes, you can confidently invest in the activities that create loyal, high-value customers.
To make this clearer, let's compare these analytical methods and the types of questions they're built to answer.
Comparing Journey Analytics Methods
| Method | Primary Use Case | Key Question Answered |
|---|---|---|
| Path Analysis | Discovering common and uncommon user flows. | What are the most popular routes to conversion? |
| Funnel Analysis | Identifying drop-off points in a predefined process. | Where are we losing potential customers? |
| Cohort Analysis | Tracking user behavior and retention over time. | Do newer customers behave differently than older ones? |
As you can see, each method tackles a different piece of the puzzle, giving you a comprehensive understanding of how customers interact with your brand over time.
Key Performance Indicators For Journey Analytics
To gauge the success of your efforts, you need to track essential metrics that paint a clear picture of customer health and business impact.
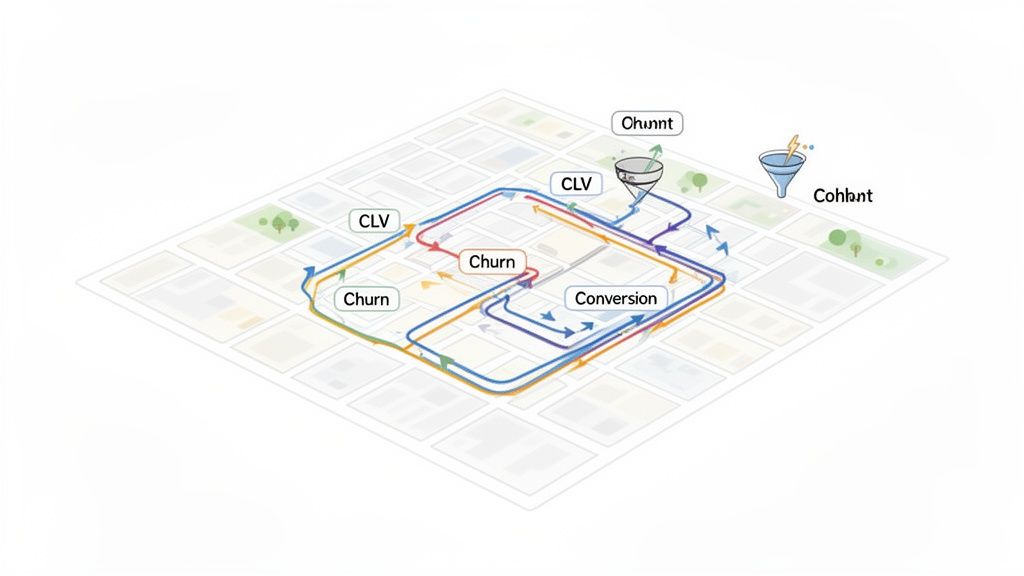
Here are the big three:
- Customer Lifetime Value (CLV): The total revenue you can expect from a single customer account. This is the ultimate measure of a healthy, long-term customer relationship.
- Churn Rate: The percentage of customers who stop doing business with you over a given period. Pinpointing why and when churn happens is absolutely critical for sustainable growth.
- Conversion Velocity: This measures how quickly a lead moves through your sales funnel. A faster velocity often indicates a more efficient and effective customer journey.
By keeping your eyes on these core metrics, you can ensure your analysis drives strategic decisions that actually move the needle. For those who want to dive deeper into measurement, our guide on digital marketing performance metrics offers more insights into tracking what truly counts.
Real-World Use Cases and Business Benefits
Theory is one thing, but seeing customer journey analytics actually drive business results? That’s where its real power shines through. We're not just talking about making prettier reports here. This is about making smarter decisions that directly fatten your bottom line. Whether you're a scrappy startup or a global powerhouse, the benefits are the same: more revenue, fiercely loyal customers, and a serious leg up on the competition.
The whole point is to turn abstract data into concrete action. Instead of guessing which marketing channels are pulling their weight, you can see the exact paths your most valuable customers take. This lets you shift your budget with confidence, doubling down on what’s working and cutting the dead weight.
Optimizing Limited Budgets for Maximum Impact
For small and medium-sized businesses (SMBs), every single marketing dollar has a job to do. Customer journey analytics is like a magnifying glass, revealing the most profitable customer paths hiding right there in your data. Just imagine finding out that customers who watch a specific product demo video before starting a trial are 40% more likely to become paying subscribers.
That kind of insight is pure gold.
It tells you exactly where to aim your ad spend and content creation to attract more of your ideal customers. You can ditch the scattergun approach and instead focus your resources on nurturing the specific sequence of interactions that you know leads to a sale. Understanding this journey is a core part of boosting performance and implementing tactics like these 10 Proven Ecommerce Conversion Rate Optimization Tips.
This focused strategy pays off in several clear ways:
- Higher ROI: Your marketing budget gets concentrated on the channels and content you've proven will convert.
- Faster Growth: By knowing what a successful journey looks like, you can replicate it to speed up customer acquisition.
- Improved Efficiency: Your team stops wasting time on low-impact activities and puts their energy where it drives revenue.
Scaling Personalization and Reducing Churn in the Enterprise
For large enterprises, the game is different, but the solution is the same. The big challenges usually shift to managing complexity at scale—things like personalizing experiences for millions of users or stopping customer churn before it starts.
Think about a major SaaS company. Journey analytics can pinpoint subtle behavioral clues that a customer is about to leave. Maybe a drop-off in feature usage paired with a recent support ticket is the red flag. With that knowledge, your customer success team can jump in with proactive help before the customer even thinks about canceling.
By blending product usage data with support tickets and marketing engagement, enterprises can spot churn signals early. This allows for proactive outreach that often cuts churn by 10-15% for key accounts.
This proactive approach is a game-changer for customer retention. It gets you out of "firefighting" mode and into a strategic, preventative mindset.
Fueling this shift is the massive move toward cloud-based analytics. Today, cloud deployments hold over 61.65% of the market share and are on track to grow at a blistering 25.1% CAGR through 2031. Brands on these platforms are reporting a 40% faster time-to-insight, which lets them tweak campaigns in real-time and boost conversion rates by 15-20%.
Building a Lasting Competitive Advantage
At the end of the day, the benefits of customer journey analytics go way beyond a single campaign. It builds a culture of data-driven decision-making that gets your marketing, sales, product, and support teams all looking at the same, shared picture of the customer.
When every department understands how their piece of the puzzle affects the overall journey, the silos start to crumble. Marketing knows which leads sales can close most easily. Product teams build features customers are actually asking for. Support teams can anticipate common frustrations.
This alignment creates a seamless customer experience that's incredibly tough for competitors to copy. It's not about one great product or campaign; it's about an entire organization optimized to deliver value at every single touchpoint. That’s how you transform a good company into a market leader—driving sustainable growth and building a loyal customer base that’s in it for the long haul.
Your Implementation Roadmap and How to Avoid Pitfalls
Jumping into customer journey analytics without a clear plan is like setting off on a road trip with no map. Sure, you might get somewhere eventually, but it’s going to be a frustrating, inefficient, and expensive ride. A structured roadmap, on the other hand, turns this complex project into a series of manageable steps, making sure your efforts lead directly to real business outcomes.
The goal isn't to boil the ocean overnight. A successful implementation always starts small with a focused pilot program. This is all about proving value quickly, building momentum, and getting the buy-in you need to scale your efforts across the whole organization.
Step 1: Define Clear Business Goals
Before you touch a single piece of data, you have to answer one critical question: "What business problem are we actually trying to solve?" Without a clear objective, your analytics project is just a data-gathering exercise with no purpose. Forget vague goals like "understand the customer better."
Instead, tie your initiative to specific, measurable outcomes. Are you trying to:
- Reduce churn in your premium subscriber tier by 10% in the next six months?
- Increase the trial-to-paid conversion rate for a new feature by 15%?
- Decrease customer acquisition costs by finding and optimizing your top three marketing paths?
Defining these goals upfront gives your entire project a north star. It helps you prioritize which journeys to analyze first and gives you a clear benchmark for measuring success.
Step 2: Identify and Map a Critical Journey
With your goals set, it's time to pick one high-impact journey for your pilot program. Trying to map every possible customer path at once is a classic recipe for failure. Instead, focus on a single journey that directly connects to the business goal you just defined.
For an e-commerce business, this might be the "first-time purchase" journey. For a SaaS company, it could be the "trial user onboarding" process. Once you’ve picked one, map out the key touchpoints involved, from the initial ad click all the way to the final conversion.
Step 3: Launch a Pilot Program to Prove Value
Now it's time to get your hands dirty. Integrate just the necessary data sources for that one journey, track user interactions, and start analyzing the path. The objective here is to find one or two "aha!" moments—those actionable insights that can deliver a quick win.
Maybe you discover that users who read a specific case study are twice as likely to request a demo. That’s gold. It’s an insight that lets you immediately adjust your content strategy and prove the value of your analytics work.
A successful pilot program acts as a powerful proof of concept. It silences skeptics and builds internal champions by demonstrating how customer journey analytics translates directly into measurable business results.
This process flow shows how those initial wins start to build toward much larger business benefits.
As you can see, focused insights are the first step to optimizing your spending, reducing customer loss, and ultimately, boosting your bottom line.
Common Pitfalls and How to Fix Them
Even with a solid plan, you're bound to hit a few common roadblocks. Knowing what they are ahead of time is the best way to keep your project on track.
The Challenge: Siloed Data. Your customer data is scattered across marketing, sales, and support systems that don't talk to each other. It’s a classic problem.
- The Fix: Don't try to integrate everything at once. For your pilot, focus only on connecting the 2-3 essential data sources needed to map your chosen journey. Use the success of this small-scale project to justify a larger investment in a unified data platform down the road.
The Challenge: Internal Resistance. Other departments might be hesitant to share their data or adopt a new way of thinking. People can be protective of their turf.
- The Fix: Frame the project around shared goals. Show the sales team how journey insights can help them identify higher-quality leads. Demonstrate to the product team how understanding user paths can inform feature development. Make it a win-win for everyone involved.
The Challenge: Proving ROI. Leadership is skeptical about the investment and wants to see a clear, dollars-and-cents return.
- The Fix: This is where your pilot program becomes your secret weapon. Present the clear, measurable outcomes from your initial analysis—like an improved conversion rate or a reduction in churn. Connect every insight directly back to the bottom line. And to make sure your campaign data is clean from the start, check out our guide on how to use UTM parameters for flawless tracking.
Choosing the Right Analytics Tools for Your Business
Picking the right technology for customer journey analytics is a huge decision. Get it right, and you accelerate growth. Get it wrong, and you’re bogged down in technical debt. The market is flooded with options, but they really boil down to three main categories, each with its own pros and cons.
The path you take should come down to your business goals, what your technical resources look like, and how mature your organization is when it comes to data.
Evaluating Your Core Needs
The most common route is using specialized point solutions. Think of these as expert tools designed to do one thing exceptionally well—web analytics, email marketing, or product analytics. They’re powerful in their own lane, but stitching them together to get a single, unified view of the customer can turn into a massive integration headache.
Another option is an all-in-one Customer Data Platform (CDP). CDPs are built from the ground up to pull customer data from all your different sources into one clean, coherent profile. They are incredibly powerful but often come with a significant investment in both cost and setup time, making them a better fit for companies that already have a solid data strategy in place.
Finally, some of the big players opt for custom-built systems. This approach gives you maximum flexibility, but it demands a dedicated team of data engineers and developers to build and maintain it. It’s easily the most resource-intensive path and is typically only for organizations with unique, complex needs that off-the-shelf tools just can't handle.
Choosing a tool isn't about finding the "best" platform on the market; it's about finding the best fit for your specific business. An SMB might thrive with a few well-integrated point solutions, while an enterprise may need the power of a dedicated CDP.
To help you sort through it all, here’s a practical framework for weighing your options.
A Quick Checklist for Tool Selection
Before you commit to any platform, run through these key factors to make sure it can grow with you:
- Integration Capabilities: How well does the tool play with your existing tech stack (your CRM, marketing automation, support desk)? Look for tools with pre-built connectors and a solid API to avoid creating more data silos.
- Scalability: Can this platform handle your data volume as your business explodes? You need a system that can scale without your costs skyrocketing or performance grinding to a halt.
- Total Cost of Ownership (TCO): Don't just look at the sticker price. You have to factor in implementation fees, training costs, ongoing maintenance, and the internal resources you'll need to manage the tool effectively.
- Ease of Use: Is the platform actually intuitive for your team? A tool packed with features is completely useless if your marketers and analysts find it too complicated for day-to-day decisions.
By carefully considering these points, you can invest in a solution that solves today's problems and supports your long-term vision. For a deeper dive, check out our guide on the best customer engagement platforms to see how different tools stack up.
Frequently Asked Questions About Customer Journey Analytics
Even after getting the basics down, you probably have a few questions about how customer journey analytics actually plays out in the real world. Let's tackle some of the most common ones to clear things up and give you some practical, straightforward answers.
What Is the Difference Between Customer Journey Analytics and Web Analytics?
Think of traditional web analytics, like Google Analytics, as a tool that tells you what happened on your website. It’s great for tracking things like page views, bounce rates, and how long someone stayed on a page. It gives you a valuable, but very narrow, snapshot of user activity on a single channel. In other words, it sees the individual trees but completely misses the forest.
Customer journey analytics, on the other hand, pieces together data from every single channel—your website, email campaigns, social media, in-store visits, support tickets—to tell you the complete story of who did what, and why they did it. It follows individual people across their entire path, over time, revealing the human story behind the numbers instead of just showing you a list of isolated events.
How Can a Small Business Start with Customer Journey Analytics?
The key is to start small and be laser-focused. Don't try to boil the ocean by tracking everything all at once. Instead, pick one critical journey that has a direct line to your revenue, like the path from a person’s first ad click all the way to their first purchase.
From there, map out only the most essential touchpoints in that specific journey. You can often connect the dots using the tools you already have, like your CRM and web analytics platform. The goal isn't perfection; it's to get one complete, end-to-end view that shows you where your biggest opportunities are hiding.
This focused approach proves the value of customer journey analytics fast. It delivers insights you can act on immediately without needing a massive investment in new tech or a huge team, making it the perfect starting point for businesses with limited resources.
What Are the Most Important Skills My Team Needs for Success?
Getting customer journey analytics right is about more than just technical chops. Success really comes down to a mix of three core skills that help your team turn raw data into decisive action: curiosity, collaboration, and clear communication.
Here’s what you absolutely need:
- Data Curiosity: This is the relentless drive to ask "why?" It's about not just accepting the numbers at face value but digging deeper to uncover the real story hiding beneath the surface.
- Cross-Functional Collaboration: Your data doesn't live in a silo, and neither should your team. You’ll need to work hand-in-hand with marketing, sales, product, and customer service to get the full picture.
- Compelling Storytelling: Data is useless if no one understands it. Your team must be able to translate complex findings into a clear, persuasive story that business leaders can immediately grasp and act upon.
At Magic Logix, we specialize in turning complex data into clear, actionable strategies. Our expertise in predictive analytics and business intelligence can help you find the hidden insights in your customer journeys and drive real growth. Discover how we can light up your customer path at https://www.magiclogix.com.