

Lead scoring models rank prospects on two axes: fit (who they are) and engagement or intent (what they do). The smartest starting point isn’t a machine-learning system. It’s a simple rule-based model that keeps fit and intent separate, adds negative scoring and decay from day one, and only layers in predictive re-ranking once you have the data to support it. Done right, this cuts wasted sales calls and lifts your MQL to SQL conversion rate.
TL;DR:
- A simple rule-based lead scoring model that separates fit and engagement signals, uses negative scoring, and applies decay from the start can significantly improve sales efficiency and conversion rates.
- Build the model around 5 to 7 core criteria, including job title, company size, demo requests, and visits to pricing pages, with negative signals like competitor domains to improve accuracy.
- Predictive scoring only becomes worthwhile after accumulating 1,000 to 5,000 labeled leads and takes several months to implement, requiring careful validation and governance.
- Maintain a lead scoring governance process with clear ownership, quarterly recalibrations, and measurement of key metrics like MQL to SQL conversion rates and false positives to prevent model degradation.
- Overengineering and lack of explainability are common pitfalls; starting with simple rules builds trust and lays a foundation for later implementing more advanced, hybrid, or predictive models.
Table of Contents
- What Do Lead Scoring Models Actually Measure?
- What Are the Main Types of Lead Scoring Models?
- How Do You Build a Lead Scoring Model Step by Step?
- When Should You Add Predictive Lead Scoring?
- What Belongs on a Lead Scoring Governance Checklist?
- What I’ve Learned Watching Scoring Models Fail
- Get Help Building and Governing Your Scoring Model
- Sources
- FAQ
What Do Lead Scoring Models Actually Measure?
A lead scoring model tracks two fundamentally different questions, and conflating them is the single most common mistake teams make. The first question is: does this person fit our customer profile? The second is: are they actually behaving like a buyer right now? Keeping these separate is what makes a model useful instead of confusing.
Explicit fit signals describe who the lead is, independent of anything they’ve done on your site. Think job title, seniority, company size, industry vertical, and tech stack. A VP of Sales at a 200-person SaaS company is a better fit than an intern at a five-person shop, regardless of how many emails either one opens.
Implicit engagement signals describe behavior: demo requests, pricing page visits, webinar attendance, email clicks, product trial usage. These signals answer whether someone is actively moving toward a purchase decision, not whether they’d make a good customer if they did.
Score fit and engagement on separate scales, then combine them into a single view (often a quadrant: high fit/high engagement gets fast-tracked, low fit/high engagement gets nurtured differently). Collapsing both into one number hides which lever moved. A lead who suddenly scores higher might be a better fit or just more active this week, and sales needs to know which.
Negative scoring and decay round out the model. Negative scoring subtracts points for red flags: a competitor domain, a personal Gmail address on a B2B form, a “just researching” job title like student or unemployed. Decay reduces a lead’s score over time if they go quiet, so a prospect who engaged heavily in January but vanished by April doesn’t still look sales-ready in May. Teams that build in negative scoring see measurable gains in model precision, largely because it stops obviously bad-fit leads from clogging the pipeline in the first place.
A conservative starting point for point values looks something like this:
- Job title matches ICP (VP, Director, C-suite): +15 to +20
- Company size within target range: +10
- Requested a demo or pricing call: +25
- Visited pricing page twice in 30 days: +10
- Opened 3+ marketing emails, no clicks: +2
- Competitor domain or free email address: -20
- No activity in 60 days: -10 (decay)
Keep the point values modest at first. Inflated scores make every lead look hot, which trains your sales team to ignore the model within a month.
What Are the Main Types of Lead Scoring Models?
Four model types dominate in practice, and most mature B2B teams end up running some version of the fourth. Here’s what each one actually does, where it breaks, and how long it realistically takes to stand up.
Rule-based scoring assigns fixed point values to attributes and actions, the kind of setup described above. Its biggest strength is explainability: any AE can look at a lead’s score and see exactly why it’s a 72 instead of a 45. That transparency is also why sales teams trust it. The limit is equally clear: rule-based models only find patterns a human already thought to encode. If your best customers share a subtle trait nobody wrote a rule for, an explicit model will never surface it. Deployment is fast, typically two to six weeks once you’ve agreed on criteria with sales.
Predictive (ML-based) scoring trains a model on historical closed-won and closed-lost data to find patterns humans would miss, things like a specific sequence of page visits that correlates with conversion, or a combination of firmographic traits nobody would have guessed mattered. The accuracy lift can be real, but it comes at the cost of explainability. When an AE asks why a lead scored 88, a pure ML model’s answer is often a shrug wrapped in a feature-importance chart. Predictive models also need a meaningful volume of historical labeled data before they outperform a well-tuned rule-based system, which is the main reason smaller pipelines shouldn’t start here.
Intent-based scoring layers in third-party signals, like a target account researching competitor terms or visiting industry review sites, that your own website analytics can’t see. This matters most for account-based marketing, where the goal is spotting buying intent before a prospect ever fills out a form. Intent data adds real value for ABM programs but works best as an input into a broader model, not a standalone score.
Hybrid scoring combines a transparent rule-based foundation with a predictive layer that re-ranks or adjusts scores within that structure. Practitioners increasingly recommend this exact setup: keep the rule-based layer as the explainable base and let machine learning refine rankings on top of it rather than replace it outright. This preserves the “why did this lead score high” conversation sales reps need, while still capturing patterns a static rule set would miss.
For most mid-market B2B teams, hybrid is where you end up eventually. The question isn’t whether to add predictive scoring, but when your data supports it, which the next section covers in more detail.
How Do You Build a Lead Scoring Model Step by Step?
Building a working model is less about sophistication and more about sequencing. Skip a step here and the whole system loses sales team buy-in fast.
- Run a joint sales and marketing workshop to set the fit gate. Before assigning a single point, agree on what an ideal customer actually looks like. Pull data from your closed-won accounts over the last four to six quarters. This session should produce a written definition of your ideal fit profile that both teams sign off on, not a marketing-only guess.
- Select 5 to 12 measurable signals and assign relative weights. More isn’t better here. A tight model built around 5 to 7 core criteria tends to predict the majority of conversions on its own, and every extra signal you add is one more thing to maintain and explain. Add signals only when you can tie them to actual closed-won outcomes, not because they seem intuitively important.
- Set tier thresholds and routing rules. On a 0 to 100 scale, a common setup routes leads scoring within a moderate threshold range as marketing-qualified (MQL) and higher scoring leads as sales-qualified (SQL), with the exact cutoff tuned to your sales capacity and average deal size. Leads below the MQL line go to nurture sequences instead of a sales rep’s queue.
- Implement negative scoring and decay, then wire automated routing. This is where the model becomes operational rather than theoretical. Connect your scoring logic to your CRM and marketing automation platform so leads crossing the SQL threshold get auto-assigned to an account executive, and leads that decay below the MQL line drop back into nurture automatically.
- Test the model against historical closed deals and iterate quarterly. Run last year’s closed-won and closed-lost leads through the new scoring logic. If your best customers would have scored low, or dead leads would have scored high, the weights need adjustment before launch, not after. Top-performing teams validate thresholds this way and then revisit the whole model every quarter as new closed-deal data comes in.
A sample point structure for a mid-market B2B company might look like this:
| Signal category | Example criteria | Point range |
|---|---|---|
| Fit: firmographic | Company size, industry match | +5 to +20 |
| Fit: role | Job title, seniority, department | +5 to +20 |
| Engagement: high intent | Demo request, pricing page visit | +15 to +25 |
| Engagement: low intent | Email open, blog visit | +1 to +5 |
| Negative signals | Competitor domain, student title | -10 to -30 |
| Decay | No activity in 60 days | -5 to -15 |
Industry benchmarks suggest allocating roughly 20 to 30% of total weight to fit signals, 35 to 45% to behavioral engagement, 20 to 30% to intent signals where available, and 10 to 15% to negative scoring and decay combined, according to implementation research from IVRistech. Those ranges are a starting point, not a formula, and your own closed-deal data should be the final word on adjustment. Teams building out their initial fit criteria often benefit from revisiting their ideal customer segmentation work first, since a fuzzy ICP produces a fuzzy fit score no matter how carefully the points are assigned.
When Should You Add Predictive Lead Scoring?
Predictive scoring earns its complexity only once you have enough historical data to train on, and jumping in early usually produces a model that’s confidently wrong. As a practical threshold, most implementations need somewhere between 1,000 and 5,000 labeled leads (meaning leads with a known closed-won or closed-lost outcome) before a predictive model starts outperforming a well-built rule-based one. Enterprise-scale gains, the kind that justify the added complexity, generally show up closer to the 5,000-plus labeled lead mark.
Timeline and cost expectations differ sharply from rule-based setups. A rules-first model can go live in weeks. A predictive pilot, by contrast, typically needs several months: time to clean historical data, train and validate the model, and run it in parallel with your existing rules before cutting over. Budget accordingly, and don’t promise your sales team predictive scoring “next month” if you’re still gathering clean historical records.
Governance matters as much as the model itself. Three guardrails keep predictive scoring from becoming a black box nobody trusts:
- Keep the rule-based layer running underneath as a sanity check, not a relic you delete once ML goes live.
- Require A/B validation before full rollout: run the predictive score alongside the rule-based score for a full sales cycle and compare which one actually predicted closed-won deals better.
- Recalibrate quarterly, using the same closed-deal review process you’d use for a rule-based model.
More advanced setups use relational machine learning, models that read connected tables across your CRM, product usage, billing, and support systems rather than a single flat spreadsheet of lead attributes. This approach can surface signals a flat-table model misses entirely, like a pattern where a prospect’s colleague converted six months earlier, or a specific sequence of content consumption that reliably precedes a purchase, according to Kumo.ai’s research on relational scoring.
Pro Tip: Run your predictive pilot on a single product line or region first. If the model’s top-tier leads convert at a meaningfully higher rate than your rule-based top tier over one full quarter, expand it. If they don’t, you’ve saved yourself a company-wide rollout of a model that wasn’t ready.
What Belongs on a Lead Scoring Governance Checklist?
A scoring model degrades into noise the moment nobody owns it. Every functioning model needs a written SLA that names an owner, states the MQL and SQL thresholds in plain numbers, defines the rejection loop when an AE kicks a lead back to marketing, and spells out exactly how leads get assigned once they cross the SQL line.
Quarterly recalibration should be a standing calendar event, not a task that only happens when conversion rates start slipping. Pair that with an annual full rebuild, where you question every signal and weight from scratch rather than just nudging numbers. Top-performing B2B organizations treat this cadence as a baseline governance practice, not an optional refinement.
Track these metrics on a recurring basis:
- MQL to SQL conversion rate, by lead source and by score tier
- AE acceptance rate (how often sales actually works a lead the model flagged)
- Score distribution heatmaps, to catch score inflation before it becomes obvious
- False positive rate: how often a high-scoring lead goes nowhere
Data hygiene deserves its own quick checklist too: set an enrichment cadence for firmographic fields, verify emails on intake to catch fake or typo’d addresses, and purge stale fields on a schedule so decayed data doesn’t quietly corrupt fit scores. A quarterly business review process is a natural home for this reporting, since it forces the SLA and the scoring model back onto the same table sales and marketing already share.
It’s a sign your thresholds or weights have drifted out of sync with what’s actually closing.*
What I’ve Learned Watching Scoring Models Fail
Most broken lead scoring models weren’t broken because the math was wrong. They were broken because someone tried to build the sophisticated version on day one, before anyone had validated the simple version against real outcomes. Overengineering is the default failure mode here, not underengineering.
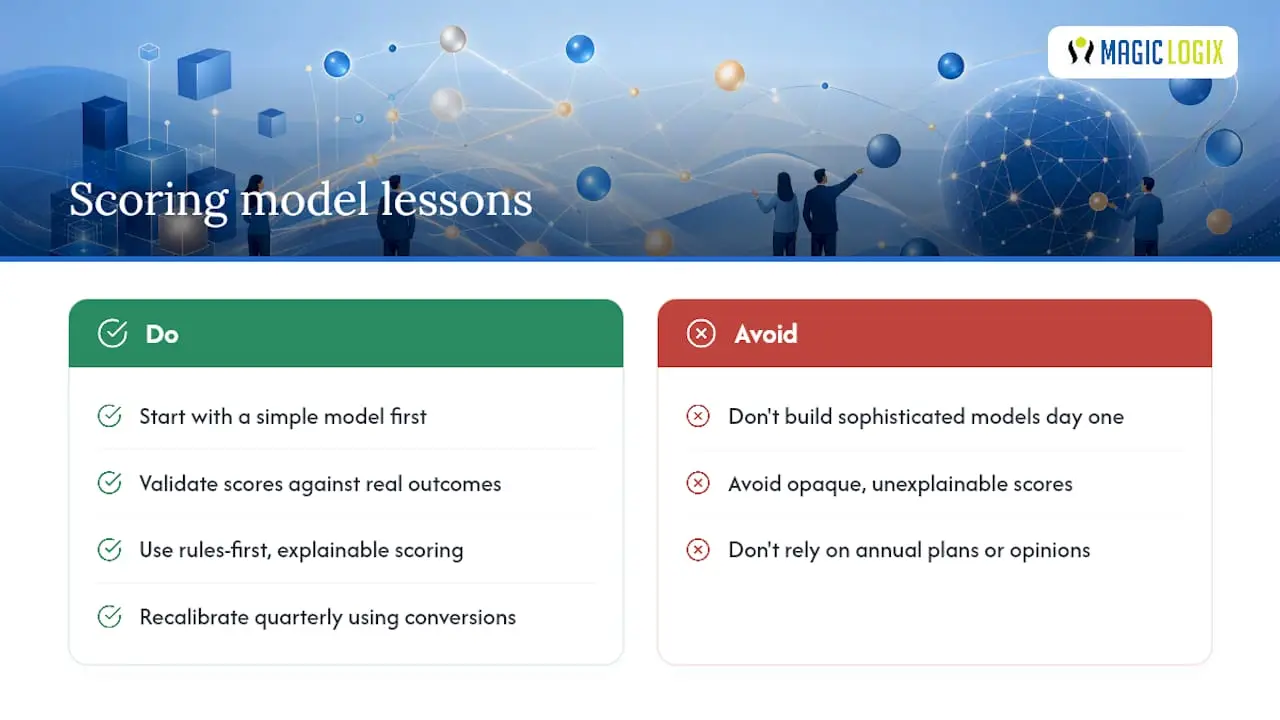
Explainability is the real adoption handrail. An account executive who can’t explain why a lead scored 82 will simply stop trusting the number, no matter how statistically sound the model is behind the scenes. That’s the strongest argument for starting rules-first: it buys you the credibility to introduce predictive scoring later without losing the room.
Let quarterly recalibration, not annual planning cycles, drive the changes. Conversions should move the model, not opinions.
— Hassan
Get Help Building and Governing Your Scoring Model
Setting up a lead scoring model that sales actually trusts takes more than a spreadsheet of point values. It takes clean data pipelines, a CRM properly wired for automated routing, and someone watching the quarterly numbers closely enough to catch drift before it costs you pipeline. This is a common challenge for revenue teams without a dedicated RevOps analyst on staff.
Some marketing and sales teams work on the full stack behind a working scoring model: data analytics to identify which signals actually predict closed-won deals, marketing automation setup to wire thresholds into CRMs, and predictive analytics pilots for teams with enough historical data to justify the next step. If your current model is either nonexistent or quietly ignored by your sales team, a scoring audit is the fastest way to find out why. Start by exploring Magiclogix’s predictive analytics services to see what a governed, hybrid scoring pilot could look like for your pipeline.
Sources
- Salesforce (resources)
- Kumo
- Prospeo — Explicit vs implicit lead scoring
- Lead scoring best practices (IVRistech)
FAQ
What Is the Difference Between Fit and Engagement Scoring?
Fit scoring measures whether a lead matches your ideal customer profile (job title, company size, industry), while engagement scoring measures buying behavior like demo requests and pricing page visits. Keeping them as separate scales prevents a highly active but poor-fit lead from looking sales-ready.
How Many Criteria Should a Lead Scoring Model Include?
Start with 5 to 7 core criteria, since a tight model tends to predict most conversions and stays easier for sales teams to trust and for marketing to maintain.
What Score Should Trigger a Sales Handoff?
A common threshold sets the MQL to SQL cutoff between 50 and 75 on a 0 to 100 scale, though the exact number should be validated against your own closed-won and closed-lost data before it goes live.
How Much Data Do You Need for Predictive Lead Scoring?
Most predictive models need roughly 1,000 to 5,000 labeled leads to outperform a well-built rule-based model, with enterprise-level gains typically requiring 5,000 or more.
How Often Should a Lead Scoring Model Be Recalibrated?
Quarterly recalibration is the industry benchmark, paired with a more thorough annual rebuild that questions every signal and weight from scratch.
Can Magiclogix Help Implement a Lead Scoring Model?
Support is available for data analytics, marketing automation setup, and predictive analytics pilots for teams building or governing a lead scoring model, from initial rule-based design through hybrid predictive rollout.