Trying to make sense of a dashboard full of numbers can feel like you're lost at sea. Think of digital marketing performance metrics as your compass and your map. These are the hard data points that show you what’s working, what isn't, and where you need to point your ship next. They cut through the noise and give you a clear roadmap for growth.
Building A Foundation for Smarter Marketing Decisions
So, which numbers actually matter? How do you draw a straight line from abstract data to real-world results like revenue and customer loyalty? To get beyond pure guesswork, you need a plan. Without clear metrics, your marketing efforts are just noise in an already crowded market, making it impossible to prove your value or fight for your budget.
The real goal here is to build a system that turns raw data into actionable intelligence. When you lock in on the right Key Performance Indicators (KPIs), you can finally answer the tough questions with confidence. You'll know exactly which campaigns are driving sales, which channels are bringing in your best customers, and where to put your next marketing dollar for the biggest return. That kind of clarity is the bedrock of any winning strategy.
From Data Points to Strategic Direction
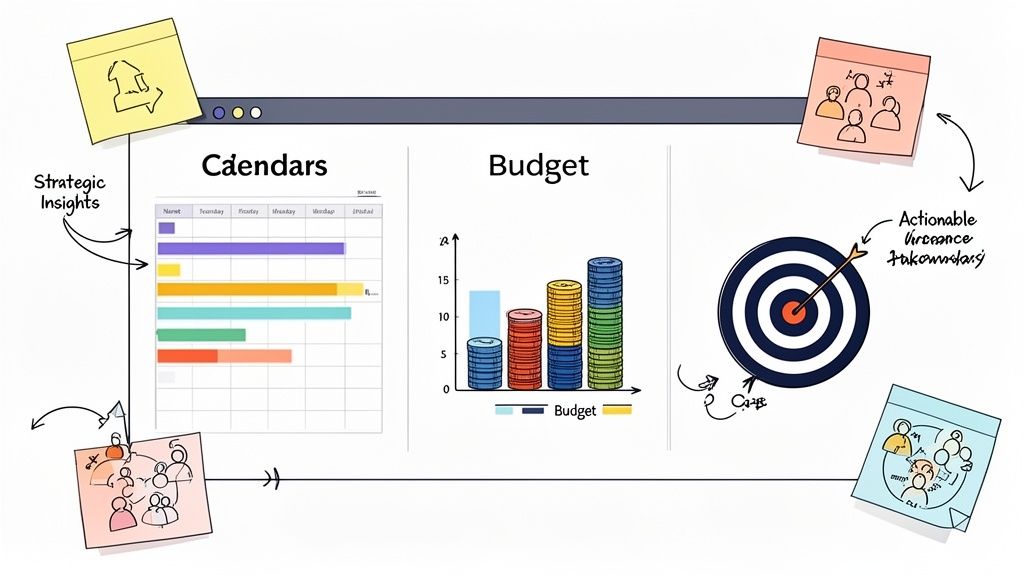
Think of individual metrics like single notes in a piece of music. One note doesn't tell you much. But when you string them together in the right order, you get a powerful melody. It's the same with your marketing data; combining different metrics tells the complete story of your customer's journey.
- Awareness Metrics: This is all about discovery. These numbers, like impressions or social media reach, tell you how many people are finding out about your brand for the first time.
- Engagement Metrics: This bucket shows you how people are interacting with your content. Are they sticking around? Metrics like time on page or video view duration give you the answer.
- Conversion Metrics: This is where the rubber meets the road. These are the bottom-line numbers that track meaningful actions, like lead form submissions or, even better, a finished sale.
By tracking performance across this entire journey—from that first "hello" to becoming a loyal advocate—you get the full picture. You can spot the exact places where customers are dropping off and, more importantly, identify the high-impact touchpoints that are pushing them forward. To get a better feel for how all these pieces fit together, understanding the latest digital marketing trends can provide some much-needed context for your measurement strategy.
The point of measuring performance isn't just to fill up a report. It's about uncovering insights that force you to make better decisions. Good measurement shows you where to double down on what's working and how to fix what's broken.
Ultimately, a rock-solid measurement foundation gives you the power to prove marketing’s impact, spend your budget wisely, and make smart, data-backed choices that move the needle.
Understanding Your Core Metrics From Traffic To Revenue
To really get a handle on your marketing performance, you have to look past the individual data points and see the story they're telling together. Think of your digital presence like a brick-and-mortar store. You need a way to measure every single step of the customer journey, from the moment someone glances at your storefront to the day they become a loyal, repeat shopper. This is exactly where your core metrics come in.
These categories are your business's vital signs. They show you how healthy your strategy is, from building initial awareness all the way through to bringing in revenue. When you organize your digital marketing performance metrics this way, you can quickly spot problems, uncover new opportunities, and finally understand how each part of your marketing machine actually contributes to the bottom line. It's a journey where each step builds on the last.
This flowchart shows how raw data gets refined into metrics that then drive smart, strategic decisions.
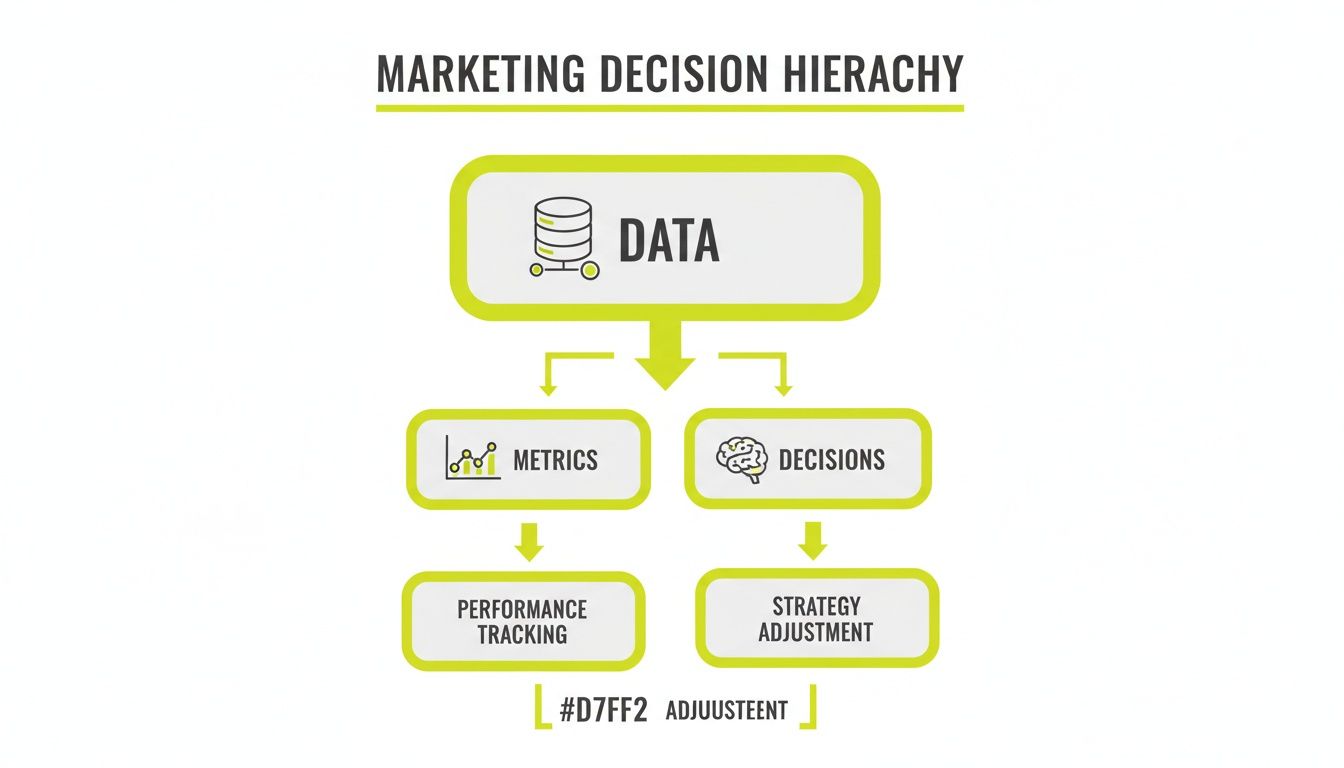
It's a continuous cycle of improvement. Great decisions aren't just based on having data; they're based on pulling meaningful insights from that data.
Traffic Metrics: Who Is At The Door?
Traffic metrics are the bedrock of your measurement framework. They answer the most fundamental question: are people actually finding us? Just like a store owner counts how many people walk through the door, these metrics quantify the size and origin of your audience.
A few key traffic numbers to watch are:
- Unique Visitors: This is the number of distinct people who visit your site in a set period. It shows you the real size of your audience, filtering out repeat visits from the same person.
- Traffic Sources: This metric breaks down exactly where your visitors came from—was it organic search, a paid ad, social media, or did they type your URL in directly? Knowing this mix is absolutely crucial for deciding where to put your budget.
- New vs. Returning Visitors: This simple ratio helps you understand how well you're attracting new people while also keeping your existing audience coming back for more.
These top-of-funnel numbers are your first signal. If traffic is low, nothing else you do down the line is going to matter.
Engagement Metrics: Are They Browsing The Aisles?
Okay, so people are in your "store." The next big question is, are they sticking around? Engagement metrics are all about measuring the quality of their experience and how well your content is landing. High traffic with terrible engagement is a huge red flag.
Engagement is the bridge between a casual visitor and a potential customer. It signals that your content is valuable, your user experience is smooth, and you've successfully captured their attention.
Important engagement metrics include:
- Bounce Rate: This is the percentage of visitors who land on a page and leave without clicking anything else. A high bounce rate could mean your content isn't what they expected or, just as often, that your page is painfully slow to load.
- Time on Page / Average Session Duration: These tell you how long people are actually spending with your content. Longer times usually mean they're genuinely interested and engaged.
- Pages per Session: This is the average number of pages someone looks at during a single visit. It’s a great way to measure how well you're guiding people deeper into your site.
Poor engagement often points back to technical problems. Slow load times are notorious for killing engagement, so it's vital to learn how to increase your page speed and keep users from clicking away.
Conversion Metrics: Did They Make A Purchase?
This is it. This is where your marketing efforts start turning into real business results. A conversion is simply any valuable action a user takes, and these metrics track how good you are at turning visitors into leads or paying customers.
Conversions come in all shapes and sizes:
- Macro Conversions: These are the big ones that directly impact revenue, like making a purchase, requesting a quote, or signing up for a subscription.
- Micro Conversions: These are smaller steps that show someone is interested, like signing up for a newsletter, downloading an ebook, or watching a demo video.
The two most critical metrics here are Conversion Rate (the percentage of visitors who take that desired action) and Cost Per Acquisition (CAC), which tells you exactly how much you have to spend, on average, to get one new customer. To really dig in, you'll want to explore specialized areas like content performance metrics.
Revenue Metrics: What Is The Final Profit?
Finally, we get to the numbers that connect everything you do directly to the company's financials. These are the metrics your CEO and CFO actually care about because they prove the ultimate value of your marketing budget.
The two undisputed champions of revenue metrics are:
- Customer Lifetime Value (CLV or LTV): This is the total profit you can realistically expect to make from an average customer over the entire time they do business with you.
- Return on Investment (ROI): The ultimate measure of profitability. It calculates how much revenue you generated for every single dollar you spent on marketing, often shown as a ratio or percentage.
By tracking these four categories of digital marketing performance metrics together, you build a complete story—from the very first click to the final sale and all the loyalty that follows. This holistic view is the secret to making smarter, data-driven decisions that fuel real, sustainable growth.
Measuring Performance Across Key Digital Channels
Treating all your marketing channels the same is like using a hammer for every job in the toolbox—sometimes you need a screwdriver. Each digital channel has its own audience, its own purpose, and its own language of success. A viral TikTok video and a high-converting email campaign are both fantastic wins, but you simply can't measure them with the same yardstick.
To get a true picture of your performance, you have to adopt a channel-aware measurement strategy. This just means understanding which digital marketing performance metrics really matter for each platform and tailoring your analysis to match. This approach keeps you from making bad calls, like punishing a social media campaign for low direct sales when its actual goal was to build brand awareness.
Search Engine Optimization (SEO) Success Signals
SEO is a long game. It’s all about earning visibility in organic search results, building authority, and driving consistent, free traffic over time. Success here isn't measured in hours or days, but in months and quarters.
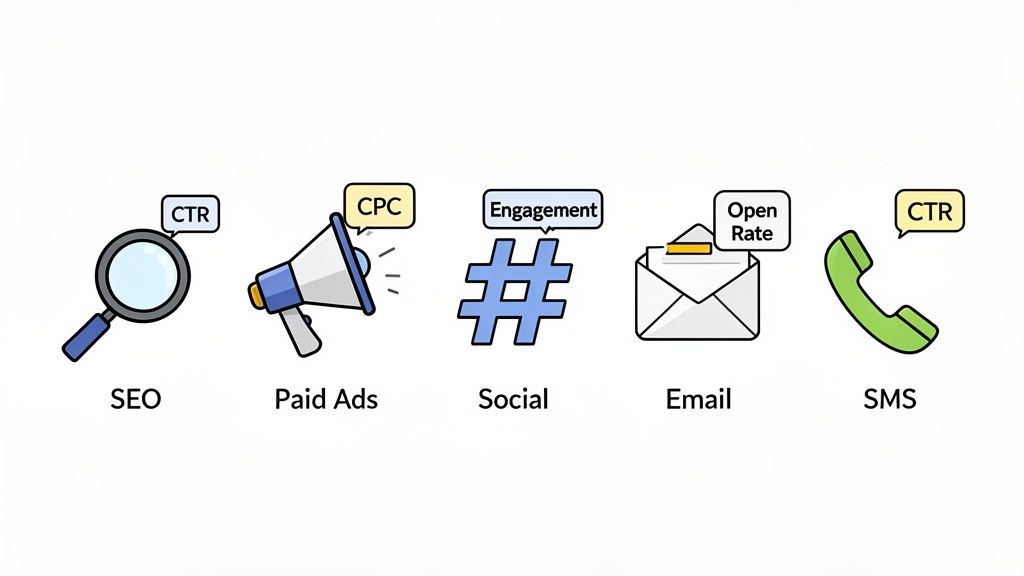
Your key SEO performance indicators really boil down to these:
- Keyword Rankings: Tracking your position for target keywords is your clearest sign of whether your content strategy is gaining traction on the search engine results pages (SERPs).
- Organic Click-Through Rate (CTR): This tells you the percentage of people who see your listing in search results and actually click on it. A high CTR is a great signal that your titles and meta descriptions are hitting the mark.
- Domain Authority (DA) and Backlinks: These metrics signal your site's overall trustworthiness to search engines. A steady climb here is a sign of a healthy, long-term strategy in action.
Paid Advertising Performance Metrics
Paid advertising, whether on Google Ads or LinkedIn, is all about efficiency and direct return. Every single dollar you spend needs to be accounted for, making these metrics absolutely crucial for allocating your budget and optimizing campaigns. Unlike SEO, paid channels demand constant monitoring and quick adjustments.
The most important metrics for your paid campaigns are:
- Return on Ad Spend (ROAS): This is the ultimate bottom-line metric. It calculates the total revenue you generate for every dollar you put into advertising. Simple as that.
- Cost Per Click (CPC): This tells you how much you're paying for each click on your ad. It's your go-to for gauging the cost-effectiveness of your targeting and ad creative.
- Conversion Rate: This tracks the percentage of ad clicks that result in a desired action, like a purchase or a lead submission. It tells you if you're attracting the right kind of traffic.
Social Media Engagement And Reach
Social media is a complicated beast. Goals can range from brand awareness and community building to driving direct traffic and sales. The metrics you prioritize must align with your specific objective for that platform. A high engagement rate on Instagram, for instance, is a huge win for brand building, even if it doesn't immediately lead to a sale.
Your social media dashboard should tell a story about your brand's relationship with its audience. Are people just seeing your content, or are they actively participating in the conversation?
Essential social metrics to keep an eye on include:
- Engagement Rate: This is a catch-all that includes likes, comments, shares, and saves. It's the best measure of how actively your audience is interacting with what you post.
- Share of Voice (SOV): This KPI compares your brand's mentions against your top competitors, giving you a real sense of your visibility and relevance within your industry.
- Traffic and Conversions from Social: While it’s not always the main goal, it's vital to track how effectively your social efforts are actually driving users to your website. For a deeper dive, check out our guide on how to analyze and improve your social media traffic.
Email And Mobile Marketing KPIs
Direct channels like email and SMS are powerful because you own the audience. But consumer behavior on these platforms is shifting, and fast. While email is still a cornerstone, mobile-first channels are showing explosive engagement.
The latest data really highlights these differences. Email marketing's global benchmark open rate is a strong 55.4%, but its click-through rates have fallen to just 3.7%. Contrast that with SMS marketing, which achieves a global click-through rate of 25.7%—nearly seven times higher than email. WhatsApp is even more impressive, with click rates hitting around 51%.
These numbers show exactly why a one-size-fits-all approach to messaging is bound to fail. Understanding these nuances is critical for creating a strategy that respects how and where your audience wants to engage.
How To Build Your Marketing Measurement Framework
Knowing your metrics is one thing, but weaving them together into a strategy that actually works is a whole different ballgame. A marketing measurement framework is your blueprint for turning all that raw data into intelligent, decisive action. It’s the system that draws a straight line from every click, share, and purchase right back to your biggest business goals.
Without a framework, you’re just collecting numbers for the sake of it. With one, you’re building a repeatable engine for growth. The real goal here is to get past simply reporting on what happened and start creating a system that guides your strategy, justifies your budget, and proves your impact on the bottom line.
Start With Your Business Objectives
Before you even think about tracking a single metric, you have to answer the most important question: What are we actually trying to achieve? Your business goals are the bedrock of your entire measurement framework. The digital marketing performance metrics you ultimately choose must be a direct reflection of these core objectives.
Is your company gunning for growth at all costs, or is profitability the top priority? Is the main objective this quarter to build brand awareness in a new market, or is it to boost loyalty among the customers you already have? Each of these goals demands a completely different set of KPIs.
Think of it like this:
- Goal: Brand Awareness – Here, your primary KPIs are all about reach and attention. You'll be tracking metrics like impressions, social media reach, and your share of voice in the market.
- Goal: Lead Generation – Now, the focus shifts to action. Your key indicators will be things like the conversion rate on your landing pages, your cost per lead (CPL), and the raw number of marketing qualified leads (MQLs) you generate.
- Goal: Customer Retention – To measure loyalty, you’ll need to monitor metrics like customer lifetime value (CLV), churn rate, and your repeat purchase rate.
Getting this alignment right isn't optional. It’s the only way to ensure your marketing team’s day-to-day work is always driving the company's most important priorities, which makes it a whole lot easier to show the incredible value of what you do.
Adopt A Proven Measurement Model
To give your thinking some structure, it helps to lean on a proven model. One of the most effective and straightforward is the AARRR framework, famously known as "Pirate Metrics." It’s brilliant because it breaks the entire customer journey down into five distinct, measurable stages.
This model tells a clear story of how a complete stranger becomes a happy, referring customer.
- Acquisition: How are people finding you in the first place? (e.g., Traffic from organic search, paid ads)
- Activation: Are they having a good first experience with your brand? (e.g., Newsletter sign-ups, free account creations)
- Retention: Are they coming back for more? (e.g., Daily active users, low churn rate)
- Referral: Do they like you enough to tell their friends? (e.g., Net Promoter Score (NPS), viral coefficient)
- Revenue: Are they opening their wallets for your product or service? (e.g., CLV, Average Revenue Per User)
Using a model like AARRR forces you to think holistically. It helps you see the entire customer lifecycle at once, preventing the common mistake of over-optimizing one area while accidentally neglecting another.
A measurement framework isn't a static document; it's a dynamic system. It must be flexible enough to adapt as your business goals and market conditions change, but structured enough to provide consistent, reliable insights over time.
Instrument Your Tech Stack For Clean Data
Let's be clear: your framework is only as good as the data flowing into it. This is where your technical setup becomes absolutely critical. If you want a reliable, 360-degree view of the customer journey, you have to make sure your core marketing tools are properly integrated and configured to talk to each other.
The goal is to create a "single source of truth" where data from all your different platforms can be unified and make sense.
- Website Analytics: Tools like Google Analytics are the foundation. You need to have clear conversion goals and event tracking set up to capture every important user action.
- CRM Platform: Your Customer Relationship Management system (think Salesforce or HubSpot) is home to all your lead and customer data. It must be connected to your marketing tools to link campaign activity directly to sales outcomes.
- Marketing Automation: Platforms such as Marketo or Pardot track engagement across email, landing pages, and more. This is where you get deep insights into how your leads are being nurtured over time.
When these systems are all communicating, you finally break down the data silos. You can see the entire path a customer took—from their very first ad click all the way to their most recent purchase. That unified view of your marketing performance is incredibly powerful.
Using Predictive Analytics To See The Future
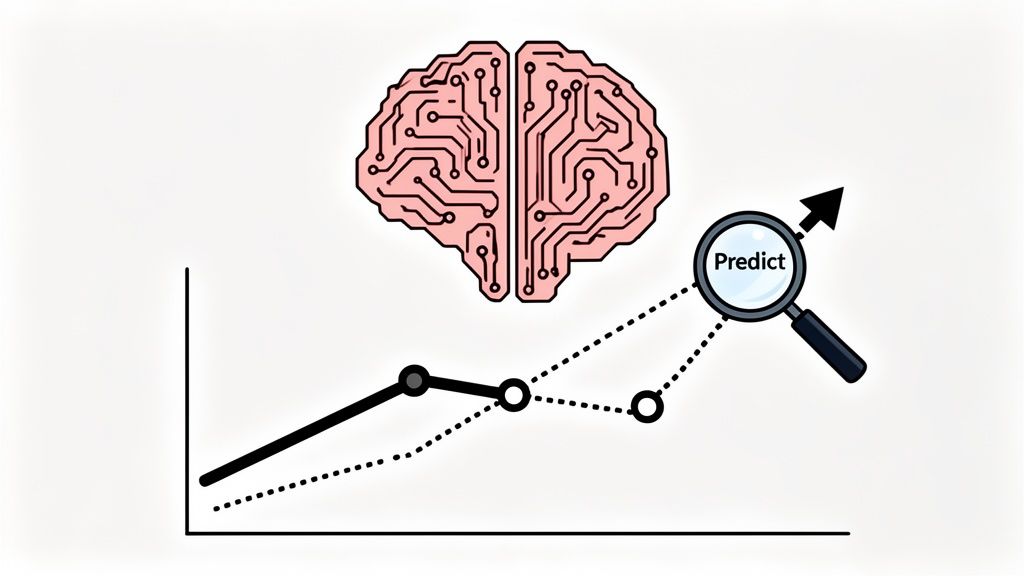
Standard reporting is a lot like looking in the rearview mirror—it tells you exactly where you've been. While that’s essential, it won't show you the road ahead. This is where predictive analytics completely changes the game, shifting the conversation from simply measuring what happened to strategically planning what's next.
Instead of only analyzing past digital marketing performance metrics, you can start to anticipate future outcomes. It’s a powerful shift from hindsight to foresight, all powered by artificial intelligence and machine learning. These technologies are fundamentally reshaping how we approach performance measurement.
Moving From Reaction To Prediction
Predictive analytics digs into your historical data, using statistical algorithms and machine learning to calculate the likelihood of future events. For marketers, this means you can finally stop just observing customer behavior and start actively predicting it.
Imagine knowing which customers are most likely to churn before they even think about leaving. Or being able to pinpoint which new leads have the highest probability of becoming your next VIP clients. That's the real power of predictive modeling.
- Predicting Customer Behavior: AI models can crunch thousands of data points to forecast actions like future purchases, subscription renewals, or potential unsubscribes.
- Identifying High-Value Segments: Machine learning algorithms sift through your audience to find hidden lookalike segments that share the traits of your very best customers.
- Automating Campaign Optimization: Predictive tools can adjust ad bids, target audiences, and even personalize content in real-time, all to maximize your chances of conversion.
This approach lets you allocate your marketing budget with surgical precision, putting your resources exactly where they have the highest probability of success.
Predictive analytics is the difference between reporting on the weather and forecasting the storm. One tells you that you're wet; the other tells you to bring an umbrella.
Adopting these technologies isn't just some niche trend; it's a massive shift. Artificial intelligence has already transformed how marketing pros measure and optimize performance, with adoption rates hitting 88% among marketers. Of those using AI, 83% report increased efficiency, and 84% note faster content delivery.
This isn't just about speed, either. It’s driving real business outcomes: around 88% of marketers using AI saw improvements in personalizing the cross-channel customer journey. Looking ahead, 78% of marketers plan to automate over a quarter of their tasks using AI within the next three years. The impact on analytics is particularly staggering—the global AI in data analytics market is projected to grow from $18.5 billion to roughly $236.1 billion by 2033.
Smarter Attribution And Deeper Insights
One of the most powerful ways AI is shaking up performance measurement is through attribution modeling. For years, marketers have leaned on simplistic models like "last-click," which gives 100% of the credit for a sale to the final touchpoint. That's like giving all the credit for a championship win to the person who scored the last point, completely ignoring the rest of the team's effort.
AI-powered attribution paints a much clearer picture. It analyzes every single touchpoint along the customer journey and assigns credit more intelligently, revealing which channels and campaigns actually influenced the final decision. This gives you a far more accurate understanding of your real Return on Investment (ROI).
On top of that, AI is taking social listening to a whole new level.
- Sentiment Analysis: Instead of just counting brand mentions, AI can analyze the emotional tone behind the conversation. Are people talking about you positively, negatively, or neutrally?
- Trend Spotting: Machine learning can detect emerging topics and trends in real-time, giving you a chance to jump into the conversation early and stay relevant.
When you connect all these dots—from predictive customer behavior to smarter attribution and deeper social insights—you can finally make marketing decisions that aren't just data-driven, but truly intelligent. This is the future of performance measurement—a future that is more precise, more proactive, and ultimately, far more profitable. To learn more about how these concepts work together, you might be interested in our guide on the role of artificial intelligence in modern business.
Turning Your Insights Into Actionable Strategies
A dashboard overflowing with data is just noise if it doesn't inspire action. This is the final, most crucial step in mastering your digital marketing performance metrics: turning those numbers into real-world business strategies. This is where insights become impact, transforming your measurement framework from a simple reporting tool into a powerful engine for growth.
Think of your dashboard as the cockpit of an airplane. It can't just show you your current altitude and speed; it has to give you the clear, immediate information you need to navigate turbulence and actually reach your destination. While tools like Google Data Studio or Tableau are great for building these dashboards, the tool itself isn't the magic. The magic is in the story you tell with your data.
That’s where effective visualization comes in. Use line charts to show trends, pie charts to break down market share, and big, bold scorecards to highlight your most critical KPIs. The goal is to make the data so compelling that even a stakeholder with zero marketing background can understand the narrative at a glance.
Avoiding Common Measurement Pitfalls
Of course, even the most beautiful dashboard is useless if it's built on a shaky foundation. So many well-intentioned measurement strategies get derailed by a few common, yet critical, mistakes. Just being aware of these traps is the first step toward building a resilient and effective measurement culture in your organization.
There are three major pitfalls I see teams fall into all the time:
- Chasing Vanity Metrics: This is a classic. It's focusing on numbers like social media likes or raw page views that feel good but have no real connection to business outcomes. Always ask yourself, "Does this metric help us make a better decision?" If the answer is no, ditch it.
- Ignoring Data Segmentation: Analyzing your data as one giant lump hides the most important insights. Segmenting by channel, demographic, or device is where the gold is. It reveals which specific areas are over-performing and which are dragging you down.
- Failing to Connect KPIs to Financials: If you can’t draw a straight line from your marketing KPIs (like lead quality) to financial outcomes (like Customer Lifetime Value), you will always struggle to prove your team's true value to the C-suite.
A successful measurement strategy isn't about tracking everything possible; it's about tracking everything that matters. The real discipline lies in filtering out the noise to focus on the signals that drive real business results and strategic pivots.
A Checklist For Actionable Insights
To keep your strategy clean and effective, you need a practical system of checks and balances. This simple list of "dos and don'ts" can help you maintain a measurement culture that empowers confident, data-backed decisions and clearly proves your marketing impact.
- DO tie every single KPI directly to a specific business objective. No exceptions.
- DON'T be afraid to stop tracking a metric that no longer serves a strategic purpose.
- DO schedule regular reviews to discuss insights, not just report numbers.
- DON'T rely solely on last-click attribution; it completely obscures the real customer journey.
This focused approach has never been more critical. The global digital advertising market is experiencing a massive expansion, projected to jump from $734.24 billion to $843.48 billion in just one year. Businesses are pouring more and more budget into digital—it now represents 72.7% of all ad investment worldwide—and the pressure to prove ROI is sky-high. You can explore more on this explosive growth and its drivers by reading about digital marketing's financial impact on Unity Connect.
By avoiding these common pitfalls and focusing on actionable insights, you can confidently demonstrate the immense value your marketing efforts bring to the table in this incredibly competitive environment.
Frequently Asked Questions About Marketing Metrics
Look, I get it. The world of marketing metrics can feel like a tangled mess of acronyms and data points. It’s easy to get lost. Over the years, I've seen the same questions pop up time and time again.
Let's clear the air and tackle some of the most common ones. Getting these fundamentals right is the first step toward building a measurement strategy that actually works.
What Is The Difference Between A Metric And A KPI?
This is a classic, and the confusion is understandable. The simplest way to think about it is that metrics are everything you can measure, while KPIs are the select few metrics you should measure.
Metrics are just data points: website visitors, email open rates, social media followers. They're measurements, plain and simple. A Key Performance Indicator (KPI), on the other hand, is a very specific metric you’ve chosen because it directly tells you if you're hitting a critical business goal.
For instance, website traffic is a metric. But Customer Acquisition Cost (CAC) is a KPI. Why? Because it’s directly tied to the business objective of profitable growth.
All KPIs are metrics, but only the most important metrics—the ones that truly measure progress against your primary goals—should be elevated to the status of a KPI.
How Often Should I Review My Marketing Metrics?
There's no single magic answer here. The right rhythm for reviewing your numbers depends entirely on what you're looking at. You need a cadence that lets you act quickly without drowning in data.
Here's a good rule of thumb:
- Weekly Review: This is for your "leading" indicators. Think daily ad clicks, social media engagement, and landing page conversion rates. These are fast-moving numbers that let you make quick, tactical adjustments to your campaigns.
- Monthly or Quarterly Review: Save this time for the "lagging" indicators that reveal the bigger story. Metrics like Customer Lifetime Value (CLV) and overall brand sentiment don't change overnight. You need to analyze them over a longer period to see the real trends and understand the long-term health of your marketing.
What Are The Most Common Mistakes When Tracking Performance?
I've seen even the sharpest teams fall into the same traps. One of the biggest is getting mesmerized by "vanity metrics"—like social media likes—that feel good but don't actually translate to business results.
Another major blunder is relying solely on "last-click" attribution. This old-school model gives 100% of the credit to the final touchpoint before a conversion, completely ignoring the complex journey that got the customer there. Finally, a huge mistake is failing to segment data. Lumping everyone together hides crucial insights about how different audiences or channels are really performing.
At Magic Logix, we help you move beyond simple reporting to build intelligent measurement frameworks that drive real growth. Discover how our business intelligence and predictive analytics solutions can give you a clear view of what's next. Learn more about our approach to data and analytics.