

Ecommerce website conversion optimization is the ongoing work of getting more of your existing visitors to buy. You measure your conversion rate, find the stage of the funnel where shoppers leave, fix the likely cause, and test the change before you keep it. DynamicYield’s average transaction conversion rate for September 2026 was 2.68%, usually hovering between 2.3% and 3%. That means roughly 97 of every 100 visits end without an order, and that gap is where your next gains are.
This guide is written for owners, marketing teams and decision-makers who want a clear process rather than a list of tricks. It covers the math, the diagnosis, the page-level fixes, testing, and how to build a plan you can keep running.
TL;DR
- Conversion rate is orders divided by visits, times 100. The published U.S. average for September 2026 was 2.68%, but your own baseline by device and traffic source matters more than any average.
- Fix the funnel from the bottom up. Leaks at cart and checkout are usually worth fixing before homepage tweaks.
- Unexpected costs, forced account creation, a long checkout and weak trust signals are the most common reasons shoppers abandon a purchase.
- Test one change at a time against one primary metric, and let the test reach its planned sample size before you decide.
- Treat optimization as a continuing program, not a one-time redesign.
Table of Contents
- What ecommerce conversion optimization actually measures
- Why conversion matters as much as traffic
- Step 1: Find where your funnel leaks
- Step 2: Remove checkout friction
- Step 3: Make product pages do the selling
- Step 4: Fix the mobile experience
- Step 5: Personalize where it is cheap to start
- Step 6: Test changes before you keep them
- Build a plan you can run every month
- Where Magic Logix fits
- Our perspective
- FAQ
- Sources
What ecommerce conversion optimization actually measures
A conversion is the action you want a visitor to take. For a store, that is usually a completed order. Salesforce defines the conversion rate as conversions divided by visitors, multiplied by 100. Five hundred purchases from 10,000 sessions gives you 5%.
Stripe uses the same logic: 50 orders from 1,000 unique visitors is also 5%. Two details keep the number honest:
- Use one definition and keep it. Decide whether you count sessions or unique visitors, and whether a conversion is a placed order or a shipped sale. Most store analytics tools default to sessions.
- Match the time periods. Orders and visits must come from the same dates, or the rate means nothing.
For a deeper explanation of the metric, see our guide to what conversion rate is and why it matters. If you are not yet sure your orders are tracked correctly, start with conversion tracking, because every later step depends on trustworthy data.
What a typical rate tells you, and what it does not
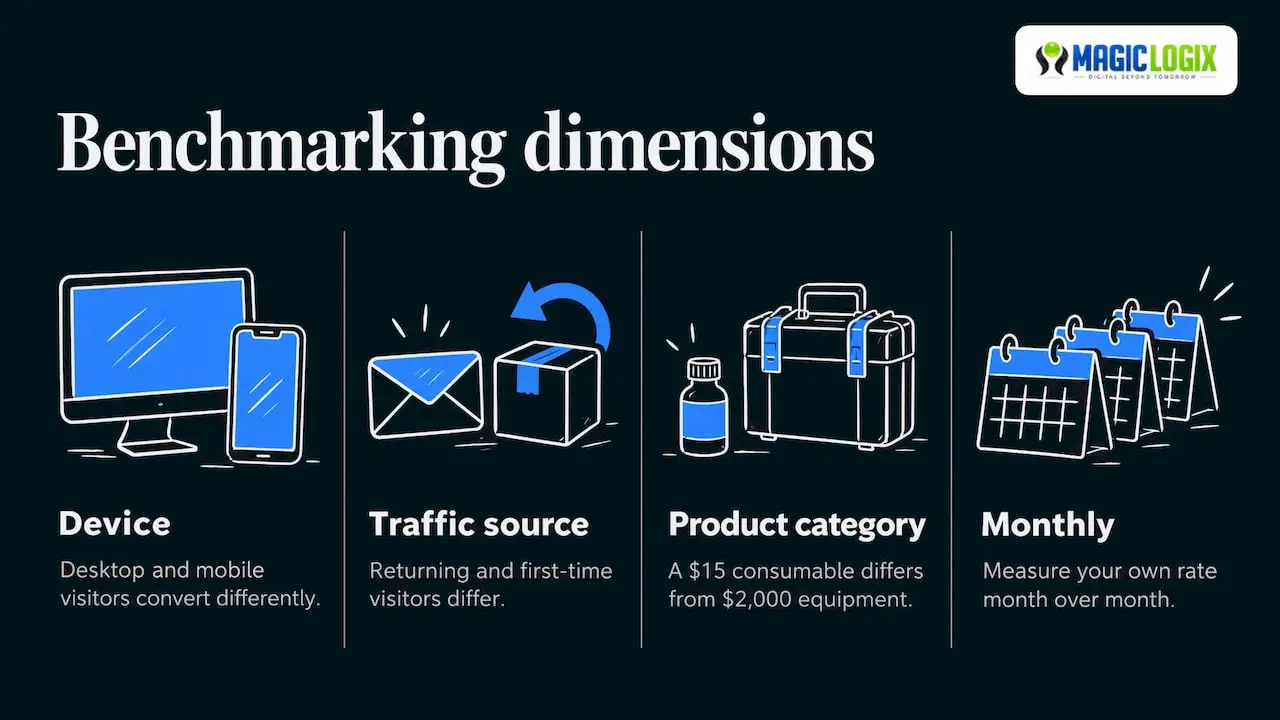
The 2.68% figure is a market-wide reference point. It moves as new data is released, so read it as a snapshot for September 2026. A store selling a $15 consumable and one selling a $2,000 piece of equipment will not convert alike, and neither will desktop and mobile visitors, or returning customers and first-time visitors.
So a question like “is 7% good?” has no single answer. A 7% rate is strong for some categories and traffic mixes, and unremarkable for others, such as repeat purchases from an email list. Your real benchmark is your own rate, split by device, source and product category, measured month over month.
Why conversion matters as much as traffic
Traffic costs money. Conversion improvements make that money go further. Salesforce makes the point that even a move from 1% to 2% doubles results without extra spend on traffic.
Here is a simple worked example, using illustrative numbers rather than a client result:
| Before | After | |
|---|---|---|
| Monthly sessions | 40,000 | 40,000 |
| Conversion rate | 1.5% | 2.0% |
| Orders | 600 | 800 |
| Average order value | $80 | $80 |
| Monthly revenue | $48,000 | $64,000 |
The same traffic produces $16,000 more revenue per month. That is why teams that already pay for search, social or ads get the most from conversion work: every visitor they have already paid for is worth more.
Step 1: Find where your funnel leaks
A conversion funnel is the path from first visit to completed order: landing, product view, add to cart, checkout, payment. Our conversion funnel guide covers the concept in more detail. The diagnostic routine is:
- Define your stages. Typically sessions, product views, add to cart, reached checkout, purchase.
- Build the funnel in your analytics. GA4 or your store platform’s built-in reporting can both show step-by-step drop-off.
- Segment the drop-off. Split by device, traffic source and landing page. A checkout problem that only exists on mobile is a different job from one that exists everywhere.
- Inspect the biggest drop. Watch session recordings, read support tickets, and walk the flow yourself on a phone.
- Test the likely cause. Form a hypothesis, change one thing, measure.
This is the sequence Shopify’s funnel guidance lays out, and it adds that leaks lower in the funnel are usually worth fixing first. The reasoning is practical: a shopper who has put something in the cart has already decided they want it, so friction at that point costs you the most.
Metrics to watch
A single number hides too much. Group your metrics so each has a job:
- Primary: conversion rate, revenue per visitor, customer lifetime value.
- Diagnostic: add-to-cart rate, reached-checkout rate, average order value, bounce rate.
- Guardrails: page speed (Core Web Vitals), gross margin, return rate.
Guardrails matter because a change can raise conversion while quietly hurting profit. A deep discount may lift orders and still lose money. This three-tier structure follows the framework in Shopify’s enterprise CRO guide.
Step 2: Remove checkout friction
Checkout is where intent turns into revenue, and where it most often disappears. Cart abandonment averages are high everywhere: the guide cited above notes that 70% of shoppers who reach checkout abandon their carts, and the same source ties abandonment to extra costs, slow delivery, lack of trust and forced account creation.
Baymard Institute’s U.S. research, summarized in a checkout optimization guide, gives specific reasons shoppers leave:
| Reason for abandoning checkout | Share of shoppers |
|---|---|
| Did not trust the site with card details | 19% |
| Site required an account | 19% |
| Checkout was too long | 18% |
| Site errors | 15% |
| Total cost not shown up front | 14% |
| Not enough payment methods | 10% |
Each of these maps to a fix you can ship:
- Show the full cost early. Display shipping and tax estimates on the product page or in the cart, not at the last step.
- Offer guest checkout. Let shoppers create an account after they pay.
- Cut fields. Ask only for what you need to ship and charge. Use address autofill.
- Add accelerated payment options. Wallets and one-click payment reduce typing on mobile.
- Show trust cues where card details are entered. Recognizable payment logos, clear return terms and a visible support contact.
- Monitor errors. Look for form validation failures and payment declines in your logs, since a broken field never shows up in a design review.
If your checkout needs structural changes, those are development tasks, and our eCommerce development service is built for that kind of work.
Step 3: Make product pages do the selling
Product pages answer the question every shopper has: is this right for me, and can I trust this store? Salsify consumer research cited by Shopify found 51% of consumers rate product titles and descriptions as the most important elements for completing a purchase. Words, not just photos, carry the sale.
A product page checklist:
- A specific title. Include the attribute buyers search by: size, material, model, compatibility.
- A description that answers objections. Fit, care, what is in the box, who it is for.
- Real images from several angles, plus scale or in-use shots.
- Delivery and returns near the buy button. Do not make shoppers hunt for policy pages.
- Reviews and questions. Social proof is most valuable on the page where the decision happens.
- A clear primary button. One obvious action, visible without scrolling on a phone.
Track the page with product-level metrics: product conversion rate, add-to-cart rate, reached-checkout rate, average order value and return rate. Shopify’s product page guidance lists these as the usual set. Return rate is a useful reality check, since a page that oversells can convert well and then bring the order back.
Good descriptions also help you be found. Clear, structured product detail supports both classic search and the AI-driven search experiences shoppers increasingly use, which is the territory of our AI search visibility work. Platform behavior there is still evolving, so treat it as a complement to conversion work and not a promise of citations.
Step 4: Fix the mobile experience
Most stores see more mobile traffic than desktop, and mobile usually converts at a lower rate. Treat that gap as a to-do list:
- Speed. Compress images, limit third-party scripts and check Core Web Vitals in Google Search Console.
- Thumb-friendly layout. Large tap targets, a sticky add-to-cart button, filters that do not cover the screen.
- Simple forms. Numeric keyboards for phone and card fields, autofill enabled.
- Fast feedback. Small, quick responses when a shopper taps a button reassure them that the action worked. Our guide to microinteractions in UX shows how.
Design choices also shape behavior in ways analytics cannot fully explain. Our article on psychology in design covers how layout, contrast and wording influence decisions, and our UI/UX design services apply those principles to real stores.
Step 5: Personalize where it is cheap to start
Personalization does not have to mean a complex engine. Start with the moments where relevance is obvious: returning visitors seeing recently viewed items, product recommendations by category, and cart reminders by email. For ideas at different budgets, see our website personalization examples. Marketing automation ties these messages to behavior, so a shopper who abandons a cart or browses a category hears from you with something relevant.
Step 6: Test changes before you keep them
A/B testing splits visitors between the current version and a variant, then compares results. A commonly used threshold for calling a result significant is 95% confidence. Rules that prevent bad decisions:
- One decision, one primary metric, written down before launch.
- Plan the sample size from your baseline rate and the smallest lift worth detecting. Low-traffic stores need either bigger changes or longer tests.
- Do not stop early because the variant looks ahead. Peeking inflates the chance of a false win.
- Cover full weekly cycles. Shopping behavior differs between weekdays and weekends.
- Check guardrails. Confirm margin, returns and speed did not suffer.
When traffic is too low for clean tests, make well-reasoned changes based on session recordings, support questions and usability sessions with five or six real customers, then compare before and after periods while noting seasonality. That is evidence, but weaker than a controlled test, so label it as such in your own reporting.
Build a plan you can run every month
Stripe describes ecommerce conversion work as an ongoing practice that spans every touchpoint from homepage to checkout. A workable monthly rhythm looks like this:
- Review the funnel by device and source.
- List hypotheses and score each by expected impact, confidence and effort.
- Ship the top one or two, starting with checkout and product pages.
- Measure against the primary metric and guardrails.
- Record what you learned, including the tests that failed.
Seasonal peaks deserve earlier preparation. Our holiday ecommerce whitepaper is one reference for planning ahead, and our ecommerce marketing strategies article shows how acquisition and conversion fit together. For the wider picture beyond stores, read website conversion optimization.
Where Magic Logix fits
Conversion work crosses disciplines: development, UX design, analytics, search and automation. Magic Logix offers eCommerce development, UI/UX design, SEO, marketing automation and digital strategy and conversion optimization, so a store’s checkout, product pages, tracking and acquisition can be planned together under our Digital Beyond Tomorrow approach. If you want a second set of eyes on your funnel, you can talk to our team about your store and goals.
Our perspective
We see conversion optimization as the half of growth that owners most often postpone. Traffic is visible and easy to buy. Friction is quieter, and it lives in the details: a shipping cost that appears too late, a form with one field too many, a product page that never answers the obvious question.
Our approach is to treat the store as one system. Design, development, analytics and search all influence whether a visitor buys, so we think they should be planned together, with measurement built in from the start. That is why we pair ecommerce development and UX design with tracking, automation and search visibility work.
We also believe in being clear about evidence. Averages are reference points, tests have to be planned, and AI search behavior is still changing. A good program says what it knows, what it is estimating, and what it will test next.
Hassan Bawab
FAQ
What is a good ecommerce conversion rate?
The published average transaction conversion rate for September 2026 was 2.68%, usually between 2.3% and 3%. A good rate for you depends on your category, price point, device mix and traffic sources, so compare against your own past performance by segment.
Where should I start optimizing my store?
Start with measurement, then fix the biggest drop-off in your funnel. Because shoppers at cart and checkout have already shown intent, leaks there are usually the best first target, followed by product pages and mobile experience.
How long should an A/B test run?
Run it until it reaches the sample size you calculated before launch, and cover full weekly cycles. There is no universal number of days, and stopping early because a variant looks ahead raises the risk of a false result.
How is conversion rate calculated?
Divide the number of orders by the number of sessions or unique visitors in the same period, then multiply by 100. For example, 250 orders from 10,000 sessions is a 2.5% conversion rate.
Sources
- Salesforce: What Is Conversion Rate Optimization (CRO)?
- Stripe: Ecommerce Conversion Rate Optimization Strategies
- Ecommerce Conversion Rate Optimization Strategies (2026), enterprise guide
- How To Find and Fix a Leaky Sales Funnel (2026)
- Checkout Optimization: Complete Guide (2026)
- Ecommerce Product Page Optimization: 11 Elements (2026)