

Conversion rate optimization (CRO) for a B2B website means raising the share of visitors who become qualified prospects, not just the share who fill in a form. Start by defining which actions count, set a baseline over a full business cycle, fix the clarity of your value proposition and your forms first, then test one change at a time against lead quality, not form volume. Magic Logix builds and optimizes websites on exactly this principle, and the steps below show how to apply it.
TL;DR
- Measure qualified conversions (leads sales will actually work), not only raw form fills.
- Build a baseline from at least one full business cycle, segmented by traffic source and device, before you change anything.
- Lead with a clear value proposition in the first seconds, then answer fit, process, proof and next steps before the form.
- Match form length to buying stage and judge every field by what it does to opportunities, not submissions.
- Test one change at a time and track each lead cohort through to closed deals.
Table of Contents
- What CRO means when the buyer is a business
- Why qualified conversion rate beats raw conversion rate
- How to calculate your B2B conversion rate and set a baseline
- Fix clarity before you fix colors
- Website UX improvements that support lead generation
- Landing page optimization for qualified leads
- Prioritize, test and measure
- A B2B CRO checklist
- Our perspective
- Where Magic Logix can help
- FAQ
- Sources
What CRO means when the buyer is a business
In consumer sales, one visit can end in a purchase. B2B is different. According to Nielsen Norman Group’s B2B usability research, business websites must support long, complex buying processes, generate leads for sales teams and serve existing customers after the sale. Visitors compare products, share options with colleagues, build shortlists and sign up for information.
That changes what you count as a conversion. A B2B site usually has several, and they are not equal:
| Conversion type | Buying stage | Typical signal |
|---|---|---|
| Newsletter or content download | Early research | Interest, low intent |
| Webinar or event signup | Evaluation | Growing interest |
| Demo, quote or consultation request | Decision | High intent |
| Pricing or comparison page views followed by contact | Shortlisting | Strong intent, often a micro-conversion |
Track each one separately. If you lump them together, a spike in ebook downloads can hide a drop in demo requests, and the second one pays the bills. Our guide to conversion tracking covers how to set these events up so each action is counted on its own.
Why qualified conversion rate beats raw conversion rate
The most useful reframe in recent B2B CRO writing comes from Dejan Predic in Search Engine Land (2026): the question is not how to increase the percentage of visitors who convert, but how to increase the percentage who become qualified prospects. Answering common buyer questions before the form can lower raw volume while producing better leads.
His example is simple. A page converting at 10% that yields 100 leads, only 10 of them qualified, loses to a page converting at 5% that yields 50 leads, 20 of them qualified. The lower rate produces twice the pipeline.
For your team, that means two numbers belong side by side on every report:
- Raw conversion rate: conversions divided by visitors.
- Qualified conversion rate: leads accepted by sales divided by visitors.
If you only watch the first, you will reward the changes that attract the wrong people.
How to calculate your B2B conversion rate and set a baseline
The formula is straightforward. As Nielsen Norman Group defines it, conversion rate is the percentage of users who take a desired action: 2,000 purchases from 100,000 visitors is 2%. For B2B, swap “purchases” for the specific action you chose, such as demo requests.
The baseline is where most teams go wrong. Follow these rules:
- Use a full business cycle. The same NN/g article advises a period long enough to smooth out B2B weekend traffic dips, with a full week as the minimum, and short enough that you can compare across several periods. Longer sales cycles justify longer windows.
- Segment the data. Split by traffic source (organic, paid, email, referral), conversion type, device, and new versus returning visitors. A blended number hides which channel is working.
- Use confidence intervals on low volume. NN/g notes that small sites should report a range, not a single figure. If you get 30 leads a month, a swing from 1.4% to 1.9% may be noise.
- Keep a log of changes. Note every launch, campaign and site edit so you can explain movements later.
A word on benchmarks
You will find published “good” B2B conversion rates, and they vary widely, because each source measures a different thing: whole-site visitors to leads, landing-page visitors to form fills, or tracked calls and chats. A single figure from a vendor survey says little about your business. Deal size, traffic source and how you define a lead all move the number.
Use benchmarks only to sense-check the order of magnitude. Your real benchmark is your own baseline, by channel, over time. A site converting at a low rate with highly qualified buyers can outperform a site converting at a high rate with poor-fit leads.
Fix clarity before you fix colors
Before testing button shades, check whether a new visitor understands what you do, who it is for and what to do next. MarketingExperiments documented this in a test of a B2B small-business site’s first seven seconds: a redesign focused on communicating the value proposition lifted visit-to-lead conversion from 4.86% in the control to 14.65% in the best treatment, a 201.3% increase in total leads. The other two treatments gained 175% and 170%. The research team’s conclusion was that clarity beats persuasion, and that what you test matters more than how you test it.
That result comes from one site in 2009, so treat it as a lesson in priorities, not a promise. The practical check for your homepage and top landing pages:
- Does the headline say what you offer and for whom, in plain words?
- Is the primary action obvious without scrolling?
- Is there one proof element (a customer name, a result you can document, a recognizable credential) near the top?
- Can a visitor tell within seconds whether they are in the right place?
Ask someone outside your company to look at the page for five seconds and write down what it does. If their answer misses, no amount of A/B testing on secondary elements will rescue it.
Website UX improvements that support lead generation
NN/g’s B2B Website Usability report is built on research in which business users tested 293 B2B sites in the United States, United Kingdom and Singapore. It covers lead-generation forms, comparison charts, pricing display and calls to action. Drawing on those themes, these are the places to look first.
Navigation that matches how buyers evaluate
Buyers want to compare, shortlist and share. Make product or service pages easy to scan side by side, and make it simple to find the pages that answer the objections a buying committee raises: pricing approach, implementation, integrations, security, support. If a page a buyer needs is three clicks deep, assume some will not find it.
Pricing and information display
Even when you do not publish a price, explain how pricing works: what drives it, what is included and what a typical engagement looks like. Visitors who cannot get any sense of cost often leave to find someone who tells them.
Forms that respect the buyer’s stage
A content download and a demo request are different commitments. A reasonable pattern is one or two fields for a download, three or four for a webinar and four to six for a demo request. Treat that as a starting point to test, not a rule.
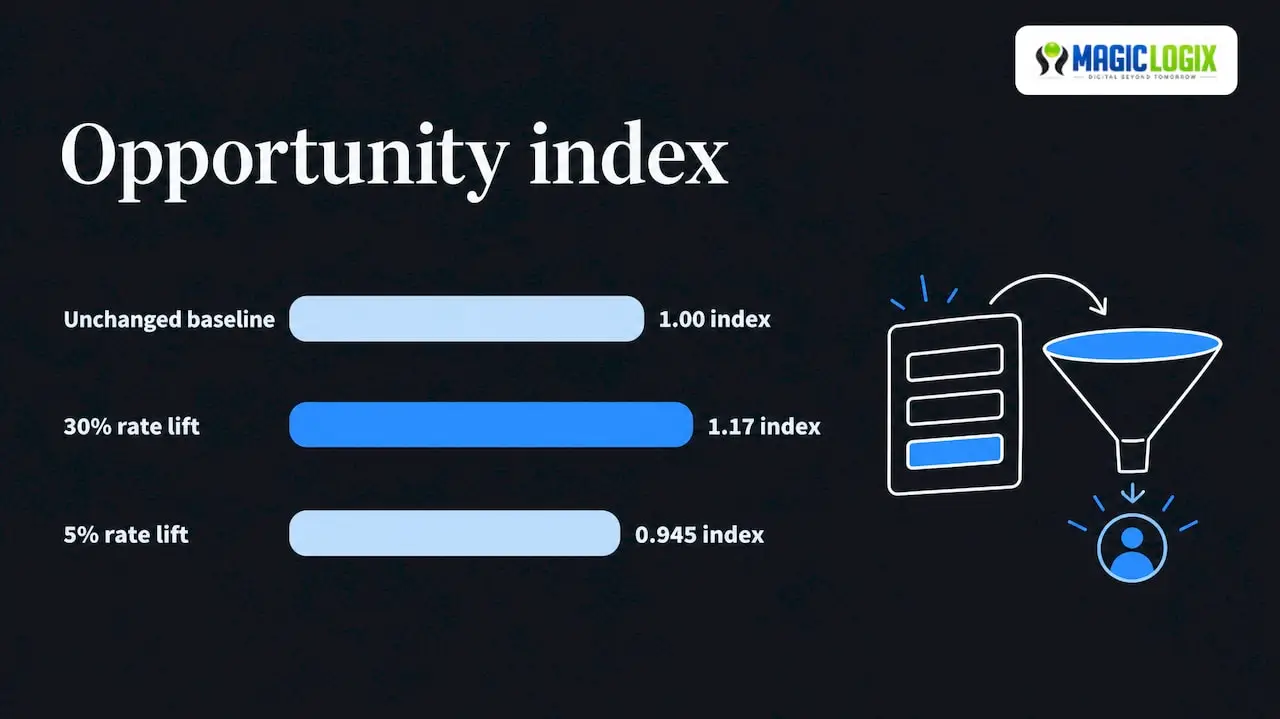
Judge every field by its effect on opportunities, not submissions. Here is an illustrative calculation (the numbers are hypothetical, for explanation only). Say adding a company-size field cuts form submissions by 10%, but sales finds that leads become opportunities 30% more often. Net effect: 0.9 × 1.3 = 1.17, about 17% more opportunities. If the field raised the lead-to-opportunity rate by only 5%, you would get 0.9 × 1.05 = 0.945, fewer opportunities, and the field should go.
Speed and mobile use
Slow pages lose visitors before they read a word, and business buyers research on phones more than many teams assume. Check your key landing pages on a mid-range phone over a normal mobile connection, not only on office broadband. Our guide to increasing your page speed walks through the common causes of slow pages.
Landing page optimization for qualified leads
A B2B landing page has one job: help the right buyer take the next step with confidence. Search Engine Land’s recommendation is to answer the common questions about fit, how it works, implementation, proof and next steps before the form. Serious buyers gain confidence, and poor fits select themselves out.
A structure that does this:
- Headline and subhead: the outcome and the audience.
- Who it is for: company size, role or situation, stated plainly. This is where you filter.
- How it works: three to five steps from first call to delivery.
- What implementation involves: time, people and effort on the buyer’s side.
- Proof: documented customer outcomes, with the context. Our guide to writing a B2B case study shows how to build proof that holds up to scrutiny.
- Next step and form: sized to the commitment, with a line on what happens after submission.
Match the page to the traffic that arrives. A visitor from a search for a specific service needs a different page than a visitor from a broad awareness campaign. Segmenting by audience, as covered in our B2B marketing segmentation guide, makes this tractable.
If you run paid campaigns, the landing page and the ad promise must agree, and your paid search management should be judged on qualified leads and cost per qualified lead, not clicks.
Prioritize, test and measure
A backlog of 40 ideas does not help. Rank them by three things: how many qualified visitors the page gets, how big the likely gap is between current and plausible performance, and how easy the change is to ship. High-traffic pages with weak performance come first. An audit of your highest-traffic pages with disappointing conversion is a sound starting point.
A simple testing routine
- Write a hypothesis. “Because visitors cannot tell who this service is for, adding a who-it-is-for block will increase qualified demo requests.”
- Choose the primary metric before the test. Qualified conversion rate, with raw rate as a guardrail.
- Change one thing. Otherwise you cannot say what worked.
- Run through full weeks. B2B traffic changes by day, so partial weeks distort results.
- Wait for enough volume. On low-traffic sites, a formal split test may take too long. Use before-and-after comparisons with confidence intervals, or bigger changes, such as a rewritten value proposition.
- Record the result, including losses.
Measure by cohort
Lead quality shows up weeks after the form submission. Track cohorts: take the leads created in a set window, then count the opportunities and closed deals that came from that same group. Mixing cohorts, for example dividing this month’s wins by this month’s leads, makes results look better or worse than they are when the sales cycle is long.
This requires your website analytics, CRM and sales team to share definitions. Agree on what counts as a qualified lead, write it down and review it quarterly with sales. Our overview of digital marketing performance metrics can help you choose which numbers go on the shared dashboard.
A B2B CRO checklist
- Conversions defined and tracked separately by type
- Qualified lead definition agreed with sales
- Baseline built over a full cycle, segmented by source and device
- Value proposition understandable in a five-second test
- Forms sized to buying stage, each field justified
- Landing pages matched to audience and traffic source
- Key pages loading quickly on mobile
- One test running at a time, with hypothesis and primary metric
- Cohort reporting from first touch to closed deal
- Quarterly review with sales
Our perspective
Most B2B websites we look at are not short of traffic or design polish. They are short of a clear connection between what the site says, what the visitor needs to decide and what the sales team defines as a good lead.
That is why we treat conversion work as part of how a site is built, not a coat of paint added later. Clear structure, fast pages, forms that fit the buying stage and tracking that follows a lead into the CRM all belong in the same plan. When design, analytics and marketing automation are planned together, a business can see which changes help pipeline and which only add form fills.
Our approach, Digital Beyond Tomorrow, also accounts for how buyers now find businesses: through search results and AI answers as well as links. A site that explains who it serves, how the work happens and what proof exists is easier for people to trust and easier for search and answer engines to understand. No one can promise rankings or citations, but clear, well-structured pages are the sound foundation.
If your conversion rate has stalled, start with a conversation about your definition of a qualified lead. Everything else follows from it.
Hassan Bawab
Where Magic Logix can help
If your audit shows that the problem is in the site itself, such as unclear structure, slow pages or forms that do not fit your buyers, our website design and development team can rebuild the pages that matter most. For a broader look at the same problem, read our guide on website conversion optimization, or talk to us about marketing and growth systems that connect your site, campaigns and CRM. A consultation is a good place to start.
FAQ
What is a good conversion rate for a B2B website?
There is no single number. Published figures differ because they measure different things, such as whole-site visitors to leads versus landing-page form fills. Compare yourself to your own baseline by traffic source, and judge success by qualified leads and pipeline, not the percentage alone.
How long should a B2B conversion test run?
Long enough to cover full weeks, since B2B traffic dips on weekends, and long enough to collect enough conversions to trust the result. NN/g advises a measurement period of at least a week, and confidence intervals for low-volume sites. Low-traffic sites should favor larger changes over tiny tweaks.
Should I shorten my forms to get more leads?
Shorter forms usually raise submissions, but not always qualified opportunities. Use fewer fields for early-stage offers and more for demo requests, then compare opportunities per visitor, not form fills, before and after any change.
Which pages should I optimize first?
Start with pages that already get meaningful qualified traffic but convert poorly: the homepage, main service pages, pricing or how-it-works pages and the landing pages tied to paid campaigns.
Can I lower my conversion rate and still improve results?
Yes. If a page answers fit, process and proof questions before the form, fewer people may submit, but those who do are better matched. Search Engine Land’s analysis shows how a lower rate can produce more qualified leads.
Sources
- B2B Website Usability, Nielsen Norman Group
- Conversion Rate: Definition as used in UX and web analytics, Nielsen Norman Group
- Why your highest-converting B2B landing page might be hurting pipeline, Search Engine Land
- Clarity Trumps Persuasion: How changing the first seven seconds, MarketingExperiments